
Predictive analytics can double cold email reply rates from 1.1% to 2.2% by using past performance to optimize targeting, copy, timing, and follow-up rules. Focus on positive replies and meetings booked, not vanity metrics like opens.
- Train predictive models on positive reply rates, not open rates or vanity metrics
- Clean data and proper authentication are required before optimization produces reliable results
- Test one variable at a time with minimum 500 sends per variant for statistical significance
- Segment sends by recipient time zone and persona for better inbox placement and engagement
- Measure success by meetings booked and pipeline generated, not opens or total replies
- Auto-revert sequences when performance drops below baseline for two consecutive weeks
Cold Email Optimization with Predictive Analytics
If your cold email reply rate moves from 1.1% to 2.2%, you double replies without sending more email. That is the whole point of predictive analytics: use past performance to pick better contacts, better copy, better timing, and better follow-up rules.
Here’s the short version:
- I would train on positive replies, not opens
- I would treat bounce rate and spam complaints as stop signs
- I would not trust tests with tiny sample sizes
- I would split sends by recipient time zone
- I would test one variable at a time
- I would judge results by meetings booked, pipeline, and cost per qualified meeting
The article also makes one thing clear: prediction is only as good as the data behind it. If domains are not set up right, contact data is old, or inbox placement is weak, the model can read a delivery problem as lack of interest. That leads to bad choices.
A simple rollout looks like this:
- Clean data and fix sending setup
- Track step-level metrics
- Set sample-size rules before testing
- Predict copy, send times, and follow-up gaps
- Retrain from reply and meeting outcomes
I Analyzed 1,500,000 Cold Emails With Claude Code. Here's What I Found.
Quick Comparison
| Area | What I’d focus on | What I’d ignore or limit |
|---|---|---|
| Training signal | Positive reply rate | Open rate alone |
| Safety checks | Bounce rate, spam complaints | Vanity metrics |
| Timing | Local time zone sends | One send time for everyone |
| Testing | A/B tests with enough volume | Early winner calls |
| Success metric | Meetings and pipeline | Raw opens |
If I had to sum it up in one line, it would be this: predictive cold email works when the data is clean, the tests are controlled, and the scorecard is tied to revenue, not inbox noise.
Build the Data Foundation Before Optimizing Sequences
Start with metrics, authentication, and sample sizes your model can trust. If the numbers underneath are noisy, missing, or warped by setup issues, the model can send you in the wrong direction with a lot of confidence. So before you tweak copy or timing, lock in the metrics that are fit for training.
Track the Right Metrics at the Sequence-Step Level
Not every metric deserves the same weight. Positive reply rate - replies from prospects who want a real conversation - is the most useful signal for training a predictive model. Total reply rate is messier because it mixes in out-of-office messages, unsubscribes, and negative replies.
Open rates aren't dependable because Mail Privacy Protection inflates them.
Bounce rate and spam complaint rate work more like guardrails than goals. If bounces jump, pause the campaign right away. Spam complaints should stay close to zero.
Set up your data as a timeline broken out by mailbox, audience segment, and sequence step. That gives the model a clear view of where a sequence starts to lose steam.
| Metric | Predictive Value | Primary Use |
|---|---|---|
| Positive Reply Rate | High | Gold standard for training intent models |
| Total Reply Rate | Medium | General engagement; noisy |
| Bounce Rate | Critical (Negative) | Stop-rule to protect sender reputation |
| Open Rate | Low | Unreliable due to Mail Privacy Protection inflation |
| Unsubscribe Rate | Medium | Signals poor targeting or a high annoyance factor in copy |
| Spam Complaints | High (Negative) | Infrastructure health; must stay near zero |
Once the signal is clean, protect it with verified data and authenticated sending.
Use Verified Data and Authenticated Sending to Reduce Bad Signals
Clean contact data and proper email authentication aren't optional. They're required. If your CRM is packed with stale records or your enrichment pipeline is shaky, the model learns from bad inputs and makes wrong calls.
Start with SPF, DKIM, and DMARC set up correctly on every sending domain. This isn't just about deliverability. It also helps stop hidden setup problems that push emails into spam without any clear alert. When messages vanish into spam folders, the model can mistake a delivery issue for lack of interest. Then it starts pushing down segments that may have converted just fine.
Shared sending infrastructure makes this worse. Isolated infrastructure keeps reputation data tied to your sends, not a shared pool. OutreachFox, for example, gives each customer a fully isolated sending environment with dedicated campaign IPs and pre-warmed mailboxes, so your performance metrics reflect your own copy and targeting decisions, not a neighbor's spam complaint.
Only after the data and infrastructure are steady should you put weight on sample-size thresholds.
Set Minimum Sample Sizes Before Trusting Model Outputs
Small samples can look good and still mean almost nothing. A solid rule of thumb: don't change copy or cadence based on fewer than 50 sends per variant. For model training, you need at least 500 reply outcomes before the model can spot real patterns instead of noise. If you have fewer than 200 outcomes, stick with manual, rule-based scoring.
For controlled A/B tests:
- Subject line tests need about 100 sends per arm with a 7-day evaluation window.
- Cadence and follow-up timing tests need 300 sends per arm and at least 21 days.
- Holdout groups should keep 15% of your contact pool out of any new model deployment, so you can check predictions against actual results before a full rollout.
- Set a meaningful winning threshold: a 20% relative improvement in positive reply rate is a reasonable bar before naming a new variant the winner.
With the data foundation in place, the next step is choosing which sequence elements to predict.
Apply Predictive Analytics to the Highest-Impact Sequence Elements
Predict Better Subject Lines and Message Angles
Once your data is clean, start with the message itself. Copy changes usually move reply rate faster than cadence changes.
Predictive systems compare baseline and challenger variants across subject lines, openers, and CTAs. Then they look at past reply patterns to spot which angles land best for each persona.
A VP of Engineering and a Director of IT don't react to the same pain points. One may care more about team speed or system risk, while the other may focus on uptime, cost, or tool sprawl. The model picks up on that difference, learns which framing leads to positive replies, and sends each contact the angle most likely to work.
After message angle, the next big lever is timing. Getting the right email in front of the right person matters. Getting it there at the right time matters just as much.
Optimize Send Times by Recipient Time Zone and Segment Behavior
Generic advice like “send Tuesday morning” sounds neat, but it falls apart fast in actual outreach. People don't all check email the same way, and predictive systems account for that.
They build engagement profiles from past reply times. If individual history is limited, they layer in firmographic signals to fill the gap.
For U.S. outreach, time zone segmentation is a must. A send scheduled for 9:00 AM ET may catch someone in New York at the right moment, but that same email lands at 6:00 AM PT in San Francisco. That's not a small detail. It changes who sees your message near the top of the inbox and who wakes up to a pile of newer emails on top of it.
Split campaigns by region:
- Eastern
- Central
- Mountain
- Pacific
Then schedule each send to the recipient's local time. Predicted windows often cluster around 10:00 AM–11:30 AM for mid-week sends and 1:00 PM–3:00 PM for Friday follow-ups. C-suite contacts usually check email earlier, around 7:45 AM–9:15 AM local time, while individual contributors are often easier to reach in the early afternoon.
Once timing is set by region and behavior, the next step is deciding how often to follow up.
Model Follow-Up Spacing, Sequence Length, and Stop Rules
Use shorter, faster sequences for high-intent contacts and longer, slower ones for low-intent contacts. A contact with a strong predicted reply score usually needs 4–5 steps. A contact with weaker signals may need 7–8 steps, so you don't burn the sequence out before they're ready.
Inside the sequence, change the send slot from step to step. For example, send Step 1 at 10:30 AM and Step 2 at 2:10 PM. That small shift can help reduce spam-filter triggers.
Stop rules are where many teams leave money on the table. If positive reply rate drops below baseline performance for two consecutive weeks, pause or retire the sequence. If bounce rate climbs above acceptable limits, stop there too.
It also helps to build auto-revert safety nets. If a new variant starts to slip, the system should roll it back to the last known good sequence instead of letting poor performance drag on.
Choose Tools and Workflows That Support Predictive Optimization
What to Look for in a Predictive Cold Outreach Platform
Once your model shows what to predict, the next move is simple: pick tools that give you the data and controls to act on those predictions.
You want a platform that gives you step-level data, automated controls, and API access for model-driven testing.
Step-level analytics are a must. Look for sent, open, and reply counts for each step, with that data available through the API. If you can't pull data at the step level, it's much harder to test changes with any confidence.
Mailbox health monitoring also matters. The platform should show mailbox health in real time and pause inboxes before reputation damage starts to spread.
Shared pools can muddy reputation data, so it's better to isolate reputation by sender. That way, one sender's problems don't spill into everyone else's numbers.
A few other features are worth a close look:
- Send-time recommendation engines tied to recipient segments
- Significance-based winner selection
- Multichannel support so email and LinkedIn steps can run in one sequence
- Real-time webhooks for bounces, replies, and mailbox health
How OutreachFox, Instantly, Lemlist, and Salesloft Differ
This comparison looks at three things: infrastructure, API access, and how deep the measurement goes.
OutreachFox is the infrastructure-first pick. Every customer gets a private, isolated sending environment with dedicated campaign IPs that are never shared with other senders. The platform is API-first, which means every dashboard action is also an endpoint. That makes it much easier to build automated optimization loops that push new variants, pull step-level metrics, and roll back to a baseline if performance slips. OutreachFox fits teams that need isolated infrastructure, API-first automation, waterfall enrichment, and native LinkedIn sequencing.
Instantly fits solo founders and small teams that want an AI interest classifier and basic send controls, but don't need native LinkedIn integration.
Lemlist fits teams that want native email and LinkedIn sequencing, but with lighter predictive depth.
Salesloft fits enterprise teams that run custom ML pipelines inside a broader sales engagement stack. It's built for large enterprise sales teams, not lean outbound programs.
| Feature | OutreachFox | Instantly | Lemlist | Salesloft |
|---|---|---|---|---|
| Infrastructure Model | Private, isolated environment; dedicated IPs | Shared warmup pools | Shared infrastructure | Enterprise-grade sending layer |
| Predictive Analytics Depth | API-first core; AI sequence builder; mailbox health monitoring | AI interest classifier; basic A/B testing | Basic A/B testing; sequence execution | Custom ML pipelines; enterprise analytics |
| Multichannel Support | Native Email + LinkedIn | LinkedIn as add-on | Native Email + LinkedIn | Broad sales engagement |
| Data & Enrichment | Waterfall enrichment (50+ providers); proprietary verification | Basic enrichment | Basic enrichment | Integrated data and CRM signals |
| API Access | All actions are endpoints; real-time webhooks | Partial API for stats and steps | Partial API for stats and steps | Robust API for CRM and data |
| Best Fit | Agencies and high-volume GTM teams | Solo founders and small teams | Creative outbound and multichannel teams | Large enterprise sales organizations |
Once the platform is in place, run the optimization loop on a fixed testing cadence.
Run a Predictive Optimization Loop and Measure Business Impact
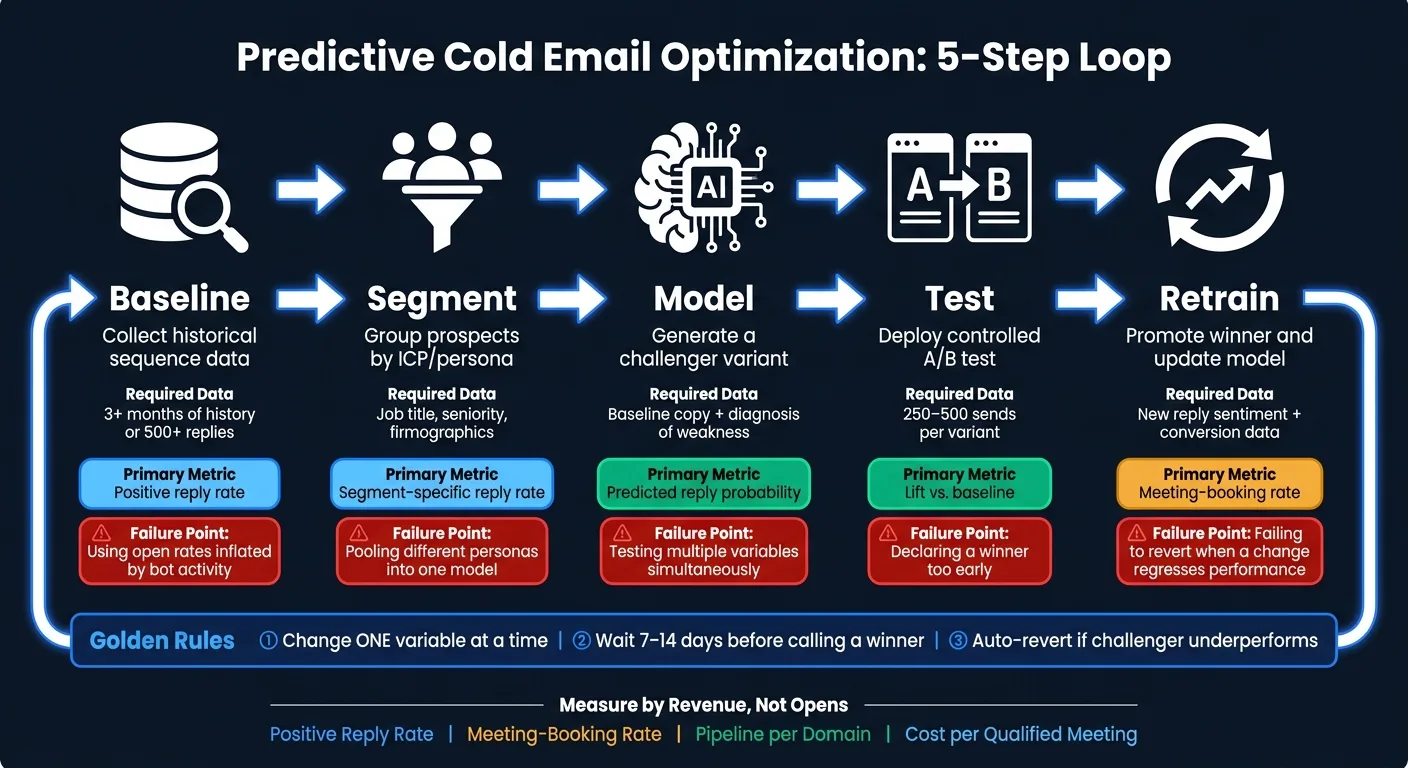
A 5-Step Process: From Baseline Data to Model Retraining
Once your data is clean and your tools are set up, the next job is simple: turn predictions into a steady test-and-learn loop you can run again and again.
| Step | Action | Required Data | Primary Metric | Common Failure Point |
|---|---|---|---|---|
| 1. Baseline | Collect historical sequence data | 3+ months of history or 500+ replies | Positive reply rate | Using open rates inflated by bot activity |
| 2. Segment | Group prospects by ICP/persona | Job title, seniority, firmographics | Segment-specific reply rate | Pooling different personas into one model |
| 3. Model | Generate a challenger variant | Baseline copy + diagnosis of weakness | Predicted reply probability | Testing multiple variables simultaneously |
| 4. Test | Deploy controlled A/B test | 250–500 sends per variant | Lift vs. baseline | Declaring a winner too early |
| 5. Retrain | Promote winner and update model | New reply sentiment + conversion data | Meeting-booking rate | Failing to revert when a change regresses performance |
A few rules keep this process honest:
- Change one variable at a time
- Wait 7–14 days before you call a winner
- Auto-revert if the challenger performs worse
That last point matters more than people think. If you change subject lines, offers, and CTAs all at once, you won't know what moved the needle.
Measure Success With Pipeline Metrics, Not Opens Alone
When the loop is live, judge it by revenue impact, not inbox vanity metrics.
Track:
- Positive reply rate
- Meeting-booking rate
- Pipeline per sending domain
- Cost per qualified meeting
Also, keep bounce rate under 5%.
Open rates are shaky. Bot activity can skew them, which makes them a poor signal for decision-making. A better move is to use AI classifiers to label inbound replies as "Interested", "Meeting Booked", "Not Interested," or "OOO".
That keeps your feedback loop clean. It also helps your model learn from the right inputs instead of noisy data.
Conclusion: Core Rules for Using Predictive Analytics in Cold Email
This loop only matters if it leads to more qualified meetings and more pipeline.
Predictive analytics works when your data is clean, your tests stay isolated, and your scorecard is tied to meetings and pipeline instead of opens. Retrain monthly, or sooner if predicted reply rates drift more than 20% from actual results.
Frequently asked questions
Why is bounce rate treated as a 'stop sign' rather than just another metric to optimize?+
Bounce rate acts as a critical safety signal that protects sender reputation. If bounces jump above 5%, it indicates serious data quality or infrastructure problems that can damage deliverability across all campaigns. The article recommends pausing campaigns immediately when bounce rates spike, because continuing to send degrades your domain reputation and causes the model to misread delivery failures as lack of interest.
What sample size is needed before making changes based on predictive model outputs?+
The article sets clear thresholds: don't change copy or cadence based on fewer than 50 sends per variant, and wait for at least 500 reply outcomes before training a predictive model. For A/B tests, subject line tests need about 100 sends per arm, while cadence tests require 300 sends per arm with a 21-day evaluation window. Below 200 outcomes, stick with manual rule-based scoring instead of model predictions.
How does time zone segmentation actually improve reply rates in cold email?+
Sending at 9:00 AM Eastern time means contacts in San Francisco receive emails at 6:00 AM Pacific, placing messages at the bottom of the inbox by the time they check email. The article recommends splitting campaigns by Eastern, Central, Mountain, and Pacific regions and scheduling each send to the recipient's local time, typically targeting 10:00 AM–11:30 AM for mid-week sends and 1:00 PM–3:00 PM for Friday follow-ups.
Why does the article recommend testing one variable at a time in cold email optimization?+
Changing subject lines, offers, and CTAs simultaneously makes it impossible to determine which element actually moved reply rates. The 5-step optimization loop specifically requires isolating variables to maintain clear cause-and-effect relationships. This disciplined approach allows the model to learn accurate patterns and prevents false conclusions about what drives engagement.
What makes OutreachFox different from other platforms for predictive cold email?+
OutreachFox provides a fully isolated sending environment with dedicated campaign IPs for each customer, preventing reputation contamination from other senders. It's built API-first so every dashboard action is also an endpoint, enabling automated optimization loops that can push variants, pull step-level metrics, and auto-revert to baseline if performance drops. This infrastructure approach fits teams running high-volume outbound programs that need clean attribution data.
How do you know when to retrain a predictive cold email model?+
The article recommends retraining monthly as a baseline, or immediately if predicted reply rates drift more than 20% from actual results. The model should also auto-revert to the last known good sequence if a new variant underperforms baseline for two consecutive weeks. Regular retraining from reply sentiment and meeting conversion data keeps predictions accurate as market conditions and audience behavior shift.
What does the article mean by measuring 'cost per qualified meeting' instead of opens?+
Cost per qualified meeting ties optimization directly to revenue impact rather than inbox vanity metrics. Opens are unreliable due to Mail Privacy Protection inflation, and high open rates don't guarantee pipeline. The article advocates tracking positive reply rate, meeting-booking rate, and pipeline per sending domain as success metrics, using these to calculate the actual cost of generating meetings that match your Ideal Customer Profile.