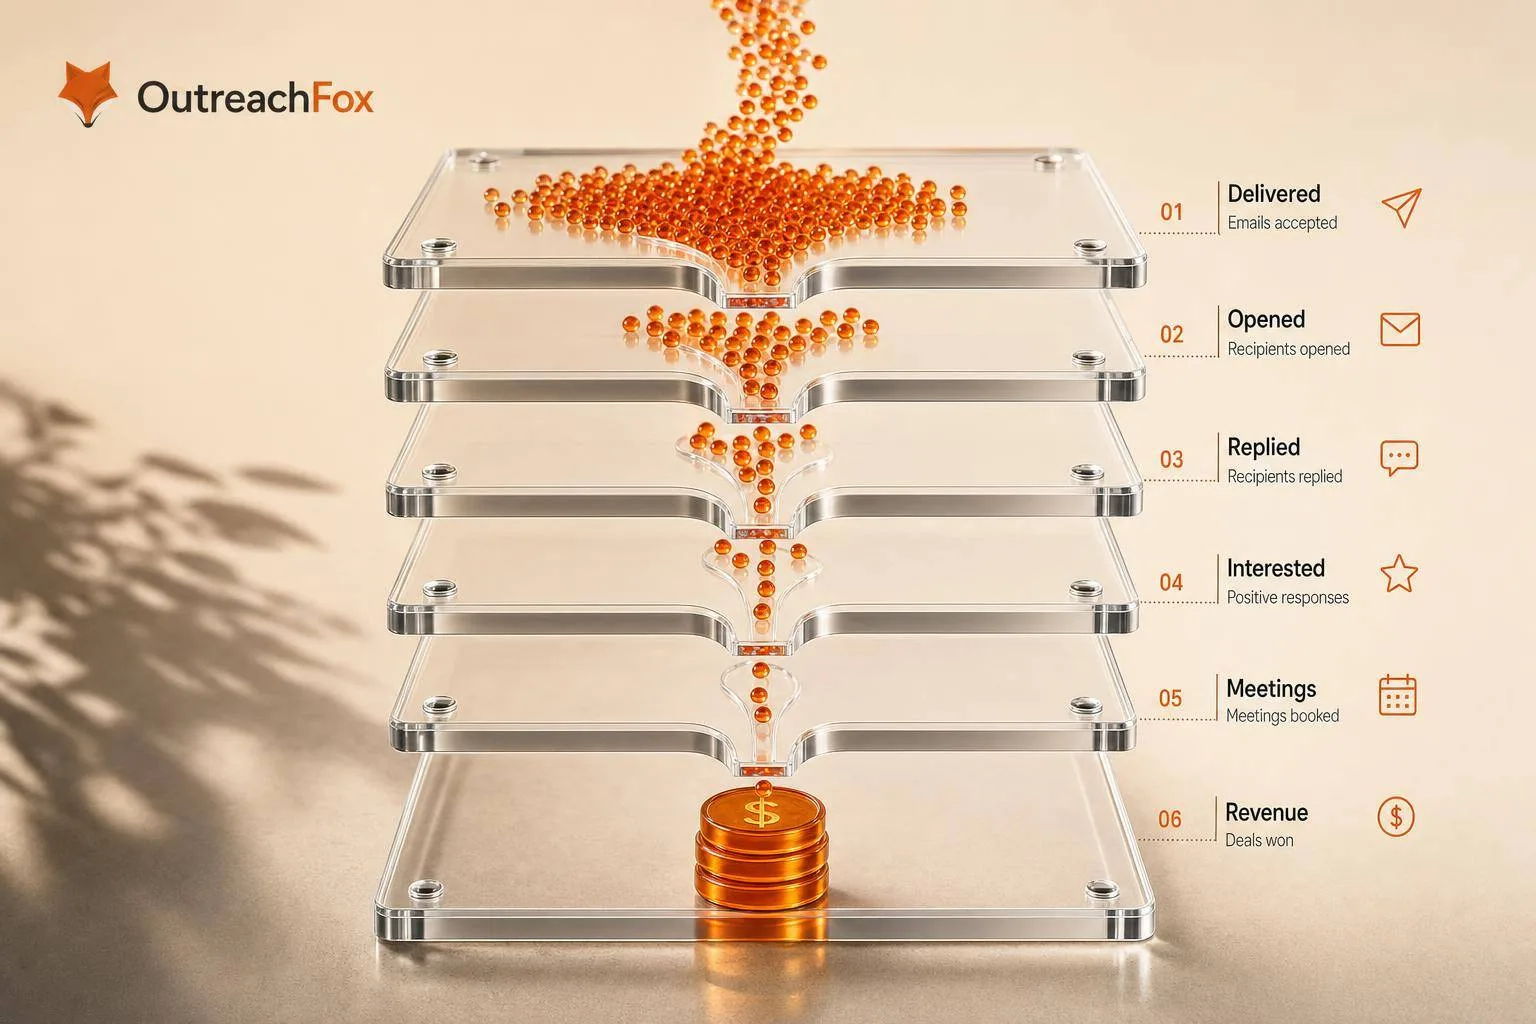
Track deliverability, positive reply rate, meetings booked, and pipeline created—not just open rates. Calculate metrics from delivered emails, review deliverability daily, engagement weekly, and pipeline monthly to connect outreach to reven
- Use delivered emails as your baseline for all calculations, not total sent
- Keep bounce rate under 2% and spam complaints below 0.1% to protect sender reputation
- Positive reply rate (1-3%) predicts pipeline better than total reply rate
- Review deliverability daily, engagement weekly, and revenue monthly for accurate insights
- High open rates mean nothing without positive replies, meetings, and pipeline
- Per-mailbox tracking reveals sender health issues before campaign averages show damage
How to Measure Cold Email Campaign Performance
If you want to know whether cold email is working, I look past opens and track four numbers first: deliverability, positive reply rate, meetings booked, and pipeline created.
Open rate can help me spot subject line or inbox issues, but it does not tell me whether a campaign is producing sales results. What matters more is whether emails get delivered, whether people reply with interest, whether meetings get booked, and whether those meetings turn into pipeline and revenue.
Here’s the short version:
- I use delivered emails as the base for my math, not total sent
- I keep bounce rate under 2%
- I keep spam complaints under 0.1%
- I treat open rate and CTR as diagnostic signals only
- I focus on positive replies instead of all replies
- I review sender health daily, reply and meeting data weekly, and pipeline monthly
A cold email campaign can show a 40% open rate and still produce 0 meetings. That’s why I read the funnel from top to bottom: delivery, replies, meetings, and revenue.
To measure cold email the right way, I first set fixed metric definitions, then clean the tracking, then check where the numbers break down. That gives me a simple way to see whether the problem is list quality, inbox placement, message fit, or follow-up.
Track These 4 Cold Email Metrics to Save Any Campaign
1. Define the Cold Email Metrics You Will Track
Before you try to improve cold email, get everyone using the same definitions.
If you skip that step, reporting falls apart fast. One person measures open rate against sent. Someone else uses delivered. Now the numbers don't match, and the dashboard stops being useful.
Deliverability, Bounce Rate, and Inbox Placement
Deliverability above 90% is the starting line, not the finish line. The formula is (Delivered ÷ Sent) × 100. If you're below 90%, check SPF, DKIM, and DMARC first.
That said, deliverability and inbox placement are not the same thing. Deliverability tells you the email was accepted. It does not tell you whether it landed in the primary inbox or the spam folder.
Bounce rate breaks into hard bounces and soft bounces. Hard bounces are permanent failures, like when the address doesn't exist. Keep bounce rate below 2%. Hard bounces do more damage than soft bounces, so pay close attention to them.
Spam complaint rate uses the formula (Complaints ÷ Delivered) × 100. This is one of the main numbers mailbox providers care about. Google and Yahoo both require senders to stay below 0.1%. Track this in Google Postmaster Tools and Microsoft SNDS, not only in your sending tool's dashboard.
Open Rate, Click-Through Rate, and Reply Rate
Open rate uses the formula (Unique Opens ÷ Delivered) × 100. Think of it as a subject line diagnostic, not a final success metric.
Why? Because the data is messy. Apple Mail accounts for roughly 50% of all email opens, and its privacy features pre-load tracking pixels. Corporate security scanners do something similar. So open rates can look better than they are.
Click-through rate (CTR) uses (Unique Clicks ÷ Delivered) × 100, but it comes with a similar problem. Security filters often click every link in an email within seconds of delivery to scan for malicious content. That makes raw CTR noisy.
Reply rate - (Total Replies ÷ Delivered) × 100 - is the first metric tied to human action. Average B2B cold email reply rates in 2026 range from 3% to 5.1%. But total reply rate still includes "not interested" replies and out-of-office messages, which is why the next layer matters more.
Positive Replies, Meetings Booked, Pipeline, and Revenue Per Send
Reply metrics only matter if they turn into meetings, pipeline, and revenue.
Positive reply rate uses (Positive Replies ÷ Delivered) × 100. This strips out the noise and focuses on replies that can move a deal forward. A realistic B2B benchmark is 1%–3%. To track it well, you need to tag replies as positive, neutral, or negative - either by hand or through automation.
Meeting booked rate uses (Meetings Booked ÷ Delivered) × 100. For well-targeted campaigns, benchmarks usually land between 0.5% and 2.0%.
Then there's pipeline generated, which is the total $ value of opportunities created. This only works if your CRM attribution is clean. And revenue per email sent pulls the whole funnel into one efficiency number.
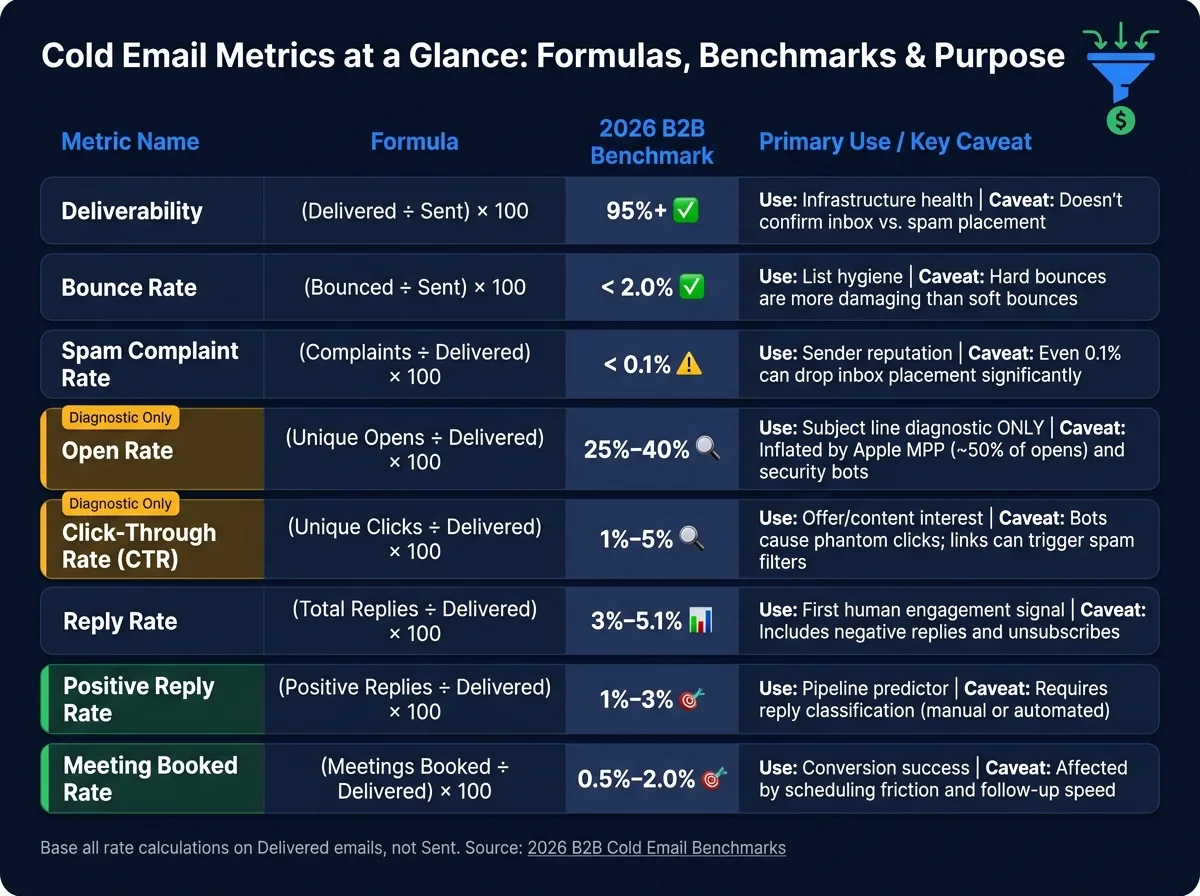
Use the table below as your single source for formulas, benchmarks, and caveats.
| Metric | Formula | 2026 B2B Benchmark | Primary Use | Key Caveat |
|---|---|---|---|---|
| Deliverability | (Delivered ÷ Sent) × 100 | 95%+ | Infrastructure health | Doesn't confirm inbox vs. spam folder placement |
| Bounce Rate | (Bounced ÷ Sent) × 100 | < 2.0% | List hygiene | Hard bounces are more damaging than soft bounces |
| Complaint Rate | (Complaints ÷ Delivered) × 100 | < 0.1% | Sender reputation | Even 0.1% can drop inbox placement significantly |
| Open Rate | (Unique Opens ÷ Delivered) × 100 | 25%–40% | Subject line diagnostic | Inflated by Apple MPP and security bots |
| CTR | (Unique Clicks ÷ Delivered) × 100 | 1%–5% | Offer/content interest | Bots cause phantom clicks; links can trigger filters |
| Reply Rate | (Total Replies ÷ Delivered) × 100 | 3%–5.1% | Engagement signal | Includes negative replies and unsubscribes |
| Positive Reply Rate | (Positive Replies ÷ Delivered) × 100 | 1%–3% | Pipeline predictor | Requires reply classification (manual or automated) |
| Meeting Booked Rate | (Meetings Booked ÷ Delivered) × 100 | 0.5%–2.0% | Conversion success | Affected by scheduling friction and follow-up speed |
With the metrics locked in, the next step is to clean up the tracking behind them.
2. Set Up Tracking and Clean Your Data Before Measuring
Before you measure anything, make sure your deliverability and sender reputation are in good shape. If the setup is broken, the numbers that come after it won't tell you much.
Check Mailbox and Domain Health First
Start by making sure SPF, DKIM, and DMARC all pass and align before you send.
Use Google Postmaster Tools to watch domain reputation and spam rate from Google's side. Use Microsoft SNDS to check IP-level health for Outlook.
Your list quality matters just as much as your setup. Business email addresses go stale fast: about 2%–3% per month. And if your bounce rate climbs above 3%, that's a clear warning that your data is weak and your sender reputation could take a hit.
Run every list through a verification tool like ZeroBounce or NeverBounce before sending. If a list is more than 30 days old, verify it again. Old data goes bad faster than most teams think.
Once your setup is clean, start logging events at the mailbox level.
Log the Right Events: Sent, Delivered, Opened, Clicked, Replied, and Complained
Every campaign needs a clean event log for Sent, Delivered, Bounced, Opened, Clicked, Replied, Unsubscribed, and Spam Complaints.
Each event shows you something different:
- Sent and Delivered show whether messages got out and reached inbox providers
- Bounced points to list or setup problems
- Opened and Clicked can hint at interest, but they don't prove business impact
- Replied, Unsubscribed, and Spam Complaints show how people actually reacted
Opens and clicks are diagnostic signals, not outcome metrics. That's an easy trap to fall into. A campaign can post solid open rates and still produce zero pipeline.
You should also split positive replies from all other replies. That includes "not interested" responses and unsubscribe requests. If you lump everything together, reply rate can look better than it is.
With clean event data, you can calculate delivery, reply, and booking rates with much more confidence.
Use Tools That Show Mailbox-Level and Campaign-Level Analytics
Track metrics at both the mailbox level and the campaign level. If you only look at campaign averages, one bad inbox can quietly drag down performance while the rest of the campaign makes things look fine.
That's the problem with many sending platforms: they show only campaign-level data. So a single mailbox stacking up complaints or bounces can stay hidden until the damage has already spread to your domain.
Campaign averages can hide a failing mailbox until reputation drops. Per-mailbox analytics show those problems early, before the averages smooth them over.
With clean tracking in place, the next step is to calculate each rate from delivered emails.
3. Calculate Core Cold Email Metrics Step by Step
Start with Delivered Emails as Your Base Number
Pull these columns from your raw campaign data: Sent, Bounced, Delivered, Opened, Clicked, Replied, and Meetings Booked.
Delivered = Sent - Bounces.
That number should be your base for every rate. Why? Because it lines up your math with the people who actually had a shot at seeing the email in their inbox.
If you use total sent instead, the numbers can get messy fast. A multi-step sequence creates more send events per lead than a one-touch campaign. That can make reply rates look lower than they are. Delivered emails give you the cleanest view of actual exposure, so start there.
If you have fewer than 500 sends, treat the results as directional. Also, wait two weeks after the final follow-up before you lock in your numbers.
Calculate Open Rate, CTR, and Reply Rate
Use the formulas below as your template. In this sample campaign, there were 1,000 sent emails and 20 bounces, which leaves 980 delivered.
| Metric | Formula | Sample Calculation |
|---|---|---|
| Deliverability | (Delivered / Sent) × 100 | (980 / 1,000) = 98.0% |
| Open Rate | (Unique Opens / Delivered) × 100 | (392 / 980) = 40.0% |
| Click-Through Rate | (Unique Clicks / Delivered) × 100 | (29 / 980) = 3.0% |
| Reply Rate | (Total Replies / Delivered) × 100 | (49 / 980) = 5.0% |
| Positive Reply Rate | (Positive Replies / Delivered) × 100 | (20 / 980) = 2.0% |
| Meetings Booked Rate | (Meetings Booked / Delivered) × 100 | (10 / 980) = 1.0% |
Treat open rate and click-through rate as directional signals, not hard truth. A high open rate might mean your subject line did its job. Or it might come from tracking noise. Reply rate is the first number that points to actual human response.
Add Positive Reply Rate and Meetings Booked Rate to Connect Activity to Pipeline
Total reply rate only tells part of the story.
A reply that says "remove me from your list" counts the same as one that says "let's set up a call" unless you separate them. And that’s where a lot of teams get tripped up.
Sort every reply into one of these three buckets:
- Positive: interested, asking for more info, requesting a meeting
- Neutral: out-of-office, referral to someone else
- Negative: not interested, unsubscribe
Then calculate positive reply rate using only the Positive group divided by delivered emails.
After that, look at meetings booked rate. This shows how well your team turns interest into actual time on the calendar. These are the numbers that tie email activity to pipeline, and they’ll help you spot the bottleneck in the next section.
4. Read the Numbers and Diagnose What Is Broken
Don't read email metrics one by one. Read them as a group.
That's how you figure out where the funnel is failing: delivery, engagement, or conversion. A single number can look bad without telling you much. But a pattern of numbers usually points to the bottleneck fast.
What Low Deliverability or High Bounce Rate Usually Means
Deliverability is the first gate. If your emails don't land in the inbox, the rest of the data doesn't matter.
A bounce rate above 3% is a serious warning sign. It can hurt sender reputation fast. A spam complaint rate above 0.10% puts you in Google and Yahoo's danger zone.
When bounce rates jump, stale or unverified list data is often the problem. Stop the campaign and run the list through a verification tool before you send again. If spam complaints are rising at the same time as bounces, you're probably dealing with poor list quality or broad, unfocused targeting.
How to Read Low Opens, Low Clicks, or Low Replies
Match the metric pattern to the most likely problem, then check it against mailbox-level data.
| Metric Pattern | Likely Root Cause | First Action |
|---|---|---|
| Low opens (<25%), low replies | Deliverability issues or spam folder placement | Check SPF/DKIM/DMARC; review Google Postmaster Tools |
| High opens, low replies | Weak offer or poor targeting | Tighten ICP and CTA |
| High total replies, low positive replies | Subject line works, offer doesn't | Align value prop to specific prospect pain points |
| High clicks, zero meetings | Security bot scanning links | Ignore click data; shift to reply-based CTAs |
| High positive replies, few meetings | Scheduling friction | Add a direct booking link; respond within one business hour |
| Sudden drop across all mailboxes | Domain blocklisting or spam folder placement | Reduce volume by 50%; check domain reputation immediately |
A few of these patterns are easy to misread.
For example, high opens with low replies usually means people are seeing the email, but the pitch isn't landing. On the other hand, high clicks with zero meetings can be a trap. In many cases, security bots are scanning links, so click data isn't telling you what humans are doing.
Why Trends Over Time Matter More Than One-Off Snapshots
A single campaign snapshot can send you in the wrong direction. One day of open or click data is noisy. Trend changes tell the clearer story.
What matters most is week-over-week movement. If reply rate slips over several weeks, the issue is often messaging drift or targeting. If performance drops all at once across many mailboxes on the same day, that usually points to infrastructure - a domain reputation hit or spam folder placement - not your subject line.
Start with per-mailbox metrics. If the drop is limited to one sender, the issue is contained. If all senders dip at the same time, your domain health needs attention right away.
5. Build a Reporting Cadence Around the KPIs That Matter Most
Once you know what each metric tells you, put it on a set review schedule. The point is simple: make measurement a habit, not a one-off audit.
Check Deliverability Daily and Reply Outcomes Weekly
It helps to think in three layers: daily, weekly, and monthly.
Check bounce rate, spam complaint rate, inbox placement, and mailbox health every day. These are your early warning signs. If bounce rate goes above 2% or complaint rate goes above 0.10%, review it right away.
Reply rate, positive reply rate, and meetings booked make more sense as weekly metrics. They move more slowly, and you need enough data for them to mean anything. If you run an agency or manage a larger sales team, pull both campaign-level data and mailbox-level data. Campaign data helps you judge messaging and targeting. Mailbox data helps you spot sender-level decline before it spreads. That split makes it easier to see what's actually broken: the list, the copy, or the sending setup.
Use monthly reporting for business results, not sender health. Review pipeline, cost per meeting, and closed-won revenue each month since those numbers trail day-to-day activity.
Use a Standard Outbound Report with Both Counts and Rates
Show both counts and rates in the same report. Rates without counts can hide volume issues. Counts without rates can hide efficiency issues.
Keep open rate as a diagnostic metric only.
| Campaign / Mailbox | Sent | Delivered | Bounce % | Open % (Diag) | Reply % | Positive Reply % | Meetings | Opps |
|---|---|---|---|---|---|---|---|---|
| Campaign A | 1,000 | 985 | 1.5% | 45% | 6.2% | 3.1% | 12 | 4 |
| Campaign B | 1,000 | 990 | 1.0% | 38% | 4.5% | 2.0% | 8 | 2 |
| Total / Avg | 2,000 | 1,975 | 1.25% | 41.5% | 5.35% | 2.55% | 20 | 6 |
Send this data into your CRM or BI tool through API or webhooks.
Conclusion: Measure from Delivery to Revenue, Not Just Opens
The whole point of this guide is to move your focus away from surface-level metrics and toward the ones tied to pipeline. Start with clean infrastructure and verified lists. Everything that happens later depends on that. Calculate your metrics from delivered emails, not sent. Put more weight on positive reply rate and meetings booked than on open rate.
Review deliverability daily, engagement weekly, and revenue monthly. Then compare each week to a rolling 4-week average. That helps you tell the difference between a one-time drop and a pattern you need to act on. When you stay consistent, cold email stops feeling like guesswork and starts looking more like a system you can trust.
Frequently asked questions
Why is open rate considered only a diagnostic metric in cold email campaigns?+
Open rate data is unreliable because Apple Mail (which accounts for roughly 50% of email opens) pre-loads tracking pixels through privacy features, and corporate security scanners do the same. This inflates open rates artificially. A campaign can show 40% opens but produce zero meetings, which is why open rate should only be used to spot subject line or inbox issues, not measure sales results.
What is the difference between deliverability and inbox placement?+
Deliverability measures whether an email was accepted by the receiving server, calculated as (Delivered ÷ Sent) × 100. Inbox placement tells you where that email actually landed—primary inbox or spam folder. An email can be 'delivered' according to deliverability metrics but still end up in spam, which is why deliverability alone doesn't guarantee your message was seen.
Why should metrics be tracked at the mailbox level and not just campaign level?+
Campaign-level averages can hide a failing mailbox until serious damage occurs. One mailbox stacking up complaints or bounces can quietly drag down overall performance while other mailboxes make the averages look acceptable. Per-mailbox analytics reveal these problems early, before they spread to your domain reputation.
What does it mean when a campaign has high clicks but zero meetings booked?+
This pattern usually indicates that security bots are scanning links rather than real prospects clicking them. Many corporate security filters click every link in an email within seconds of delivery to scan for malicious content, creating phantom click data. In this case, click data isn't showing human behavior and should be ignored in favor of reply-based calls to action.
How often should business email lists be verified before sending cold emails?+
Business email addresses decay at about 2-3% per month, so lists should be verified before every send. If a list is more than 30 days old, it must be verified again before use. Running lists through verification tools like ZeroBounce or NeverBounce prevents bounce rates from climbing above 3% and protects sender reputation.
What is the recommended review cadence for different cold email metrics?+
Check deliverability metrics (bounce rate, spam complaints, inbox placement) daily as early warning signs. Review engagement metrics (reply rate, positive reply rate, meetings booked) weekly since they need sufficient data to be meaningful. Examine business results (pipeline, cost per meeting, revenue) monthly because these outcomes trail day-to-day activity.
What benchmarks indicate a cold email campaign needs immediate attention?+
Stop and investigate immediately if bounce rate exceeds 3%, spam complaint rate goes above 0.1%, or deliverability drops below 90%. These thresholds put sender reputation at serious risk with providers like Google and Yahoo. A sudden drop across all mailboxes on the same day typically signals domain reputation issues or spam folder placement requiring a 50% volume reduction.