
To debug Outreach webhooks, verify delivery in provider logs, return 200 OK within 5 seconds, log event IDs with body hashes, and use idempotent handlers to prevent duplicate processing.
- Check Outreach delivery logs first to confirm the webhook was actually sent
- Return 200 OK within 5 seconds and queue heavy processing asynchronously
- Log event IDs, status codes, latency, and SHA-256 body hashes for traceability
- Verify signatures against raw request body before middleware modifies payload
- Implement idempotent handlers using event IDs to prevent duplicate processing
- Monitor p99 latency, error rates, and volume drops to catch silent failures early
Best Practices for Debugging Webhooks in Outreach
If an Outreach webhook breaks, I check three things first: did Outreach send it, did my endpoint answer in under 5 seconds, and did my app process it once. That short flow catches most failures.
Here’s the core idea in plain English: I split problems into delivery, auth, timeout, processing, and duplicate/state issues. Then I use provider logs, endpoint logs, latency, signature checks, and event IDs to find the break. A few guardrails do most of the work: log every delivery, verify the raw body, return 200 OK fast, and queue the heavy work.
At a glance, these are the main takeaways:
- Start with Outreach delivery logs to see whether the request was sent at all
- Watch the 5-second timeout because slow handlers get marked as failed
- Log IDs, status codes, latency, headers, and a SHA-256 hash of the raw body
- Use idempotency so retries do not create duplicate CRM records or alerts
- Track drops in event volume because a webhook can fail even when your app still looks healthy
- Replay requests with ngrok or
curlto test the same payload again - Check HTTPS, DNS, redirects, and path mismatches when nothing reaches your server
- Separate staging and production with different endpoints and secrets
A few numbers stand out: p99 latency above 5 seconds is a risk, non-2xx errors above 10% over 15 minutes need attention, signature failures above 5% over 5 minutes often point to secret or raw-body issues, and event volume dropping by more than 50% hour over hour can signal a silent failure.
If I had to boil the whole article down to one line, it would be this: validate, enqueue, acknowledge, and trace every event from receipt to final update.
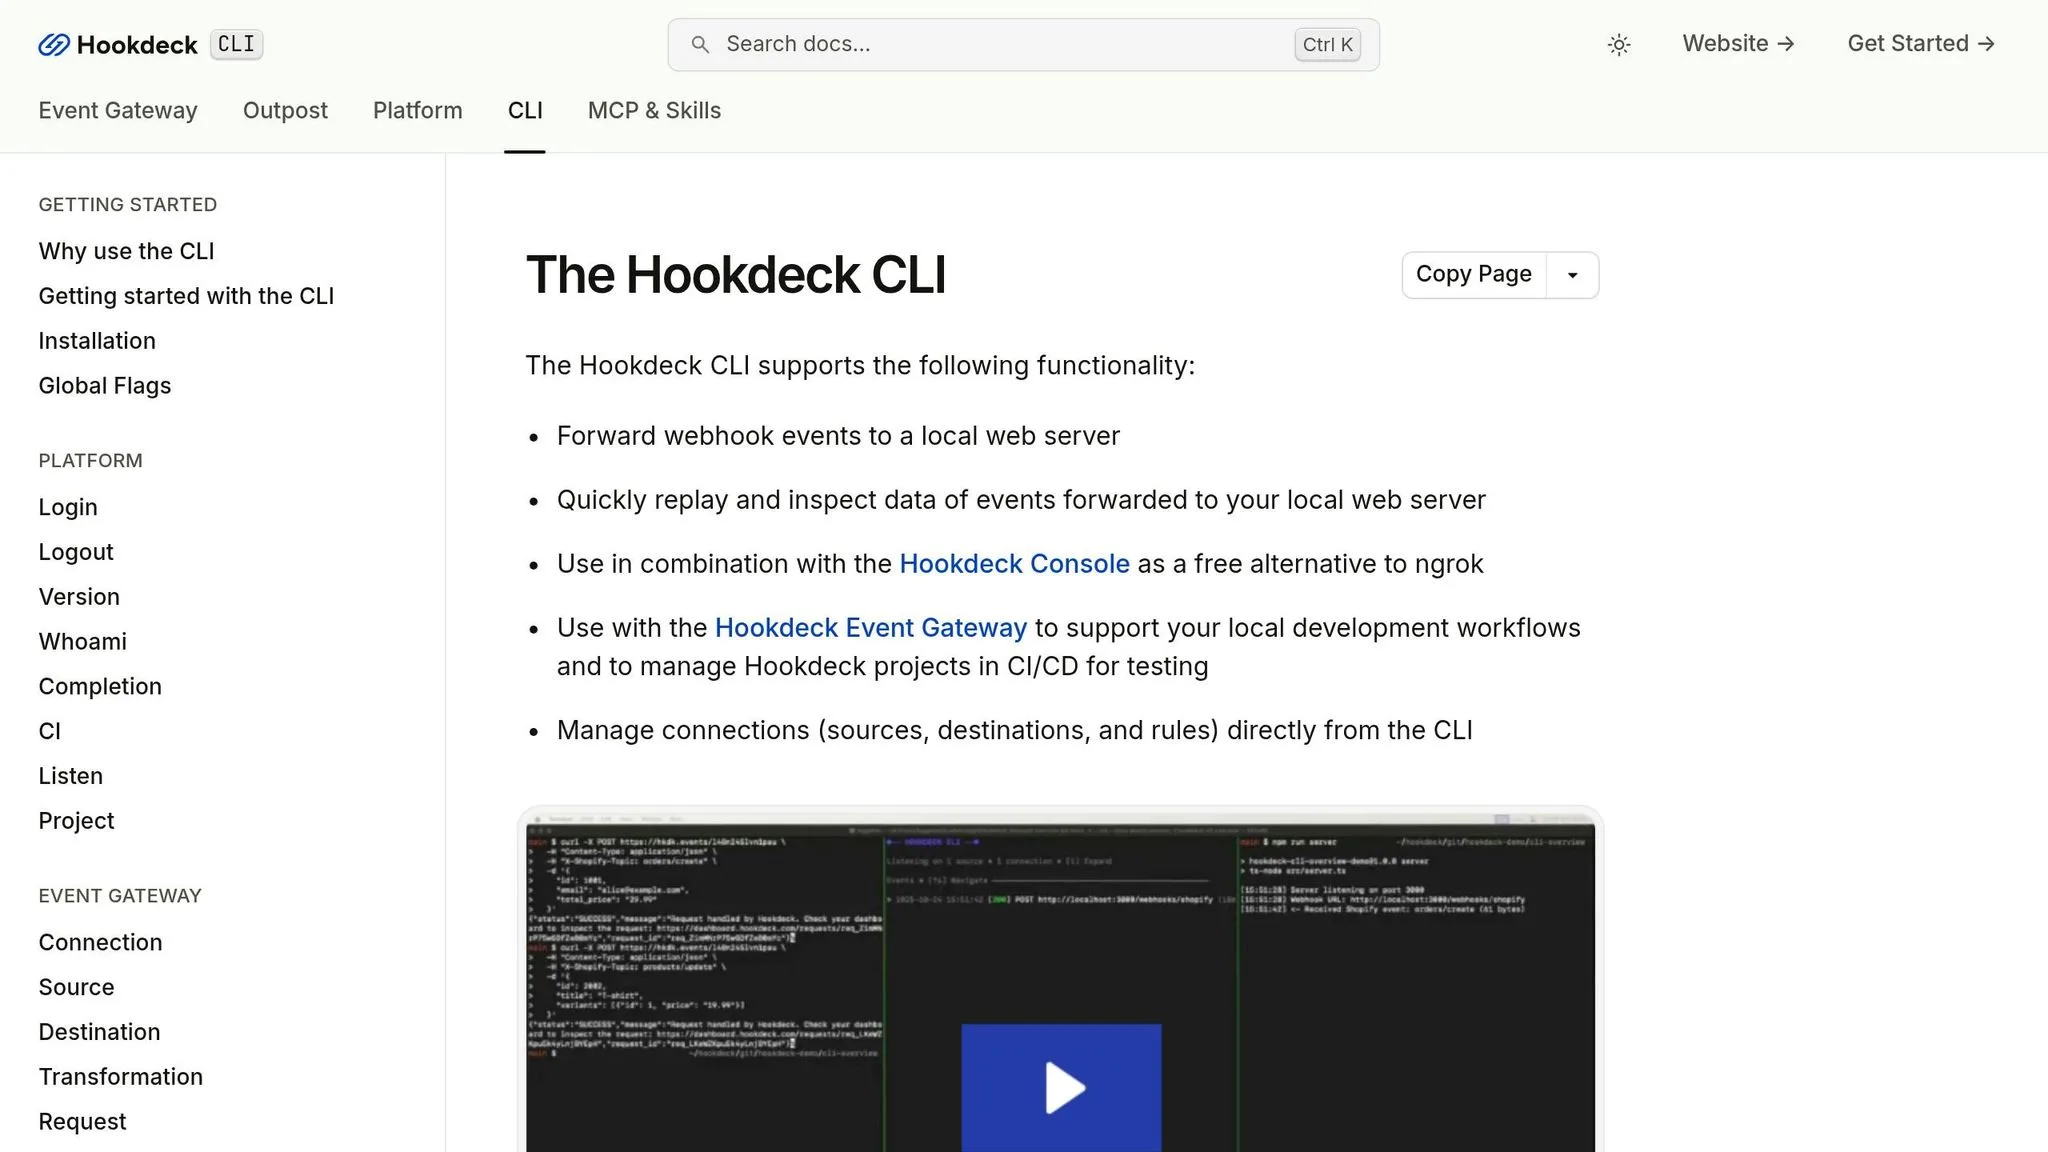
Test and Debug Localhost Webhooks with the Hookdeck CLI (v1.1)
Add logs, metrics, and error handling to your webhook endpoint
Once you know the failure bucket - delivery, auth, timeout, processing, or state - the next move is simple: make sure every webhook delivery leaves a trail. If you don't have structured logs and basic monitoring in place, you're not debugging. You're guessing.
Log each delivery with correlation IDs and SHA-256 hash of the raw request body
Each webhook delivery should create a log entry with, at minimum:
- timestamp
- event ID
- delivery ID
- event type such as
prospect.updatedormailing.opened - status code
- handler latency
- SHA-256 hash of the raw request body
Do not log the full request body in production. It often includes PII, and storing that data can turn a small issue into a bigger one. Instead, log the SHA-256 hash of the raw request body.
That hash gives you a clean way to check whether the bytes your server received match what the provider sent, without keeping sensitive payload data around. And that detail matters. Webhook signatures are based on the exact raw bytes, so you want the hash of the raw body - not a parsed version, not prettified JSON, not anything your app touched after receipt.
If signature verification fails, that hash check is often the fastest way to spot middleware that changed the payload before your handler saw it.
Also log the signature and content-type headers with the body hash. Then assign a correlation ID to each delivery and pass it through background workers and queues. If you skip that step, tracing one event across an async pipeline gets messy fast. The same ID also helps when you're tracking duplicate events or missing records downstream.
Return clear HTTP responses and make handlers idempotent
Once logging is in place, focus on how the endpoint responds.
Return a 200 OK as soon as you've verified the signature and queued the job. Don't keep the provider waiting while you do heavy work. That processing should happen in the background.
Outreach has a strict 5-second response timeout. If your endpoint runs longer than that, the delivery is marked as failed.
So the pattern is straightforward: validate, enqueue, and return a 2xx right away.
Your handler also needs to be idempotent because webhooks can retry. One retry after a network blip shouldn't create two CRM records or send the same alert twice. Outreach does not retry after 500 or 429 responses, so response handling needs to be deliberate.
A common setup is to store each event ID in a deduplication table with a unique constraint. Before you process the event, check whether that ID is already there. If it is, skip the duplicate.
Monitor error rate, latency, and event volume
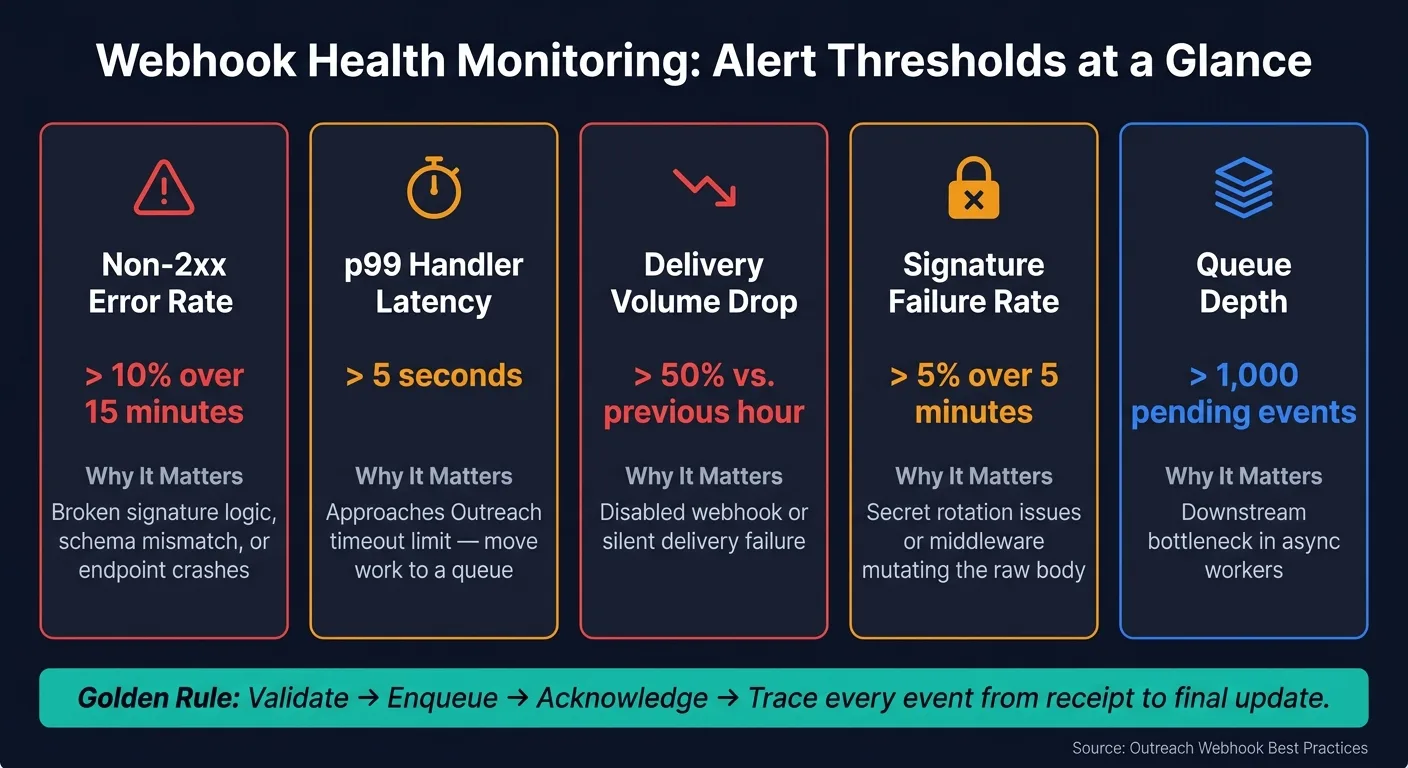
Five metrics will catch most webhook health issues:
| Metric | Alert Threshold | Why It Matters |
|---|---|---|
| Non-2xx error rate | > 10% over 15 minutes | Broken signature logic, schema mismatch, or endpoint crashes |
| p99 handler latency | > 5 seconds | Approaches timeout limit; move work to a queue |
| Delivery volume drop | > 50% vs. previous hour | Disabled webhook or silent delivery failure |
| Signature failure rate | > 5% over 5 minutes | Secret rotation issues or middleware mutating the body |
| Queue depth | > 1,000 pending events | Downstream bottleneck in async workers |
You don't need a fancy monitoring setup here. Any stack that can alert on these signals is fine.
One signal is easy to miss: delivery volume drop. Your endpoint can stay online, keep returning 200, and still stop receiving events because the provider stopped sending them. If you don't watch volume, that kind of failure can sit there for hours before anyone notices.
With these signals in place, the next step is reproducing the failure from provider logs or a local tunnel.
Use provider delivery logs and local tunnels to reproduce failures
Start with the provider, not your code. The delivery log tells you where to look.
If there’s no delivery log, the problem is usually on the delivery side. If you see a logged 4xx or 5xx, the request reached your endpoint and the issue is usually in how your app handled it. That one detail helps you sort the problem into the right bucket: delivery, setup, or handler-side.
Start with the outreach platform's delivery logs
In Outreach.io, webhook delivery logs are under Settings > Plugins & Integrations > Webhooks. Each entry shows the timestamp, target URL, status code, and latency. Use that screen to confirm whether Outreach sent the request and what your endpoint sent back.
If a hostname can’t be resolved or points to a private IP range, Outreach will temporarily disable the webhook. If that issue stays in place for a week, the webhook is disabled permanently.
If Outreach shows a send, move on to the endpoint checks.
Verify the public endpoint configuration
Check the basics first:
- Protocol: HTTPS only.
- Certificate: Verify the full chain with
openssl s_client -connect your-api.com:443 -showcerts. Self-signed certs and incomplete chains break TLS. - Path: Match
/webhookexactly. Even a trailing slash mismatch can stop delivery. - Redirects: Outreach does not follow redirects.
- DNS: Point the hostname to a public IP, not a private range.
Replay requests with ngrok or a webhook inspector
If the setup looks right, replay the request locally. A tool like ngrok gives your local server a public HTTPS URL. Update the webhook URL in Outreach to the ngrok address, such as https://abc123.ngrok.io/webhook, then trigger a test event.
Now you can receive live webhook traffic on your machine and debug it with breakpoints in your editor. That’s often the fastest way to spot what’s going wrong.
The ngrok web interface at http://localhost:4040 shows every incoming request, including full headers and payloads. It also has a Replay button, so you can resend the exact same request as many times as you want. If you can’t trigger a live event, grab the production payload from the Outreach delivery log and replay it with curl. Include the Outreach-Webhook-Signature header so your signature check runs the same way it does in production.
For a fast look at payloads without running local code, use Webhook.site. It gives you an instant public URL with no setup. That makes it handy for quick payload and header checks. Just be careful: it stores data off-site, so don’t send requests that include sensitive prospect data through it.
| Tool | Best Use Case | Pros | Cons | Security Consideration |
|---|---|---|---|---|
| Provider Logs (Outreach) | Confirming delivery status and response codes | Source of truth; no setup required | Limited payload visibility | Access controlled by user role |
| Local Tunnels (ngrok) | End-to-end debugging with breakpoints | Real traffic; easy replay; full IDE access | Exposes local port publicly; URLs change on free tier | Use password protection; keep firewall active |
| Webhook Inspectors (Webhook.site) | Quick payload and header inspection | No setup; instant public URL | No local code execution; manual replay only | Payloads stored off-site; avoid sensitive data |
Troubleshoot webhook failures in a fixed order
Use your logs and delivery status to sort failures in this order: no delivery, bad response, then data-quality issues. At this stage, you’ve already narrowed the problem down. Now go through each branch, one by one.
When no webhook reaches your endpoint
If your delivery logs show no attempt at all, the problem is happening before the request ever gets to your server.
Work through this sequence:
- Confirm the event fired. Check that the right event type and trigger are turned on in your webhook settings, and make sure the webhook status is Active.
- Check DNS. Outreach can disable a webhook when DNS fails. If those failures keep happening for a long time, the webhook can be disabled for good.
- Verify HTTPS. Plain HTTP endpoints are rejected. Use OpenSSL to make sure the certificate is valid and that the full intermediate chain is installed.
- Check your firewall or WAF. Outreach does not publish fixed egress IPs, so static allowlists can break delivery.
If the request is hitting your server, stop looking at transport and start looking at response codes.
When you get 4xx, 5xx, or timeout errors
Each status range usually points to a different kind of problem.
For 401/403 errors, verify signatures against the raw request body, not parsed JSON. In Express, that means using express.raw() or an equivalent method before middleware changes the payload.
For 400 errors, inspect the Content-Type header and compare the incoming payload structure with what your parser expects. Schema drift often causes this kind of failure.
For 5xx errors, head straight to your application logs. Check for unhandled exceptions, database connection failures, or memory leaks. A 503 often means the backend behind your load balancer is down, or the queue is full.
For timeouts, return 200 OK right away and send the real work to a background queue like Redis or SQS. Keep posted-event handling under 5 seconds, or move it to a queue. Also check the provider’s retry behavior before you change handler logic.
Once delivery and response look stable, shift your focus to event order and payload shape.
When events are duplicated, out of order, or missing fields
These three issues usually come back to the same idea: defensive event handling.
For duplicates, store the event id from the webhook payload in your database with a unique constraint. If the same ID shows up again - which can happen during retries - skip processing and return 200 OK.
For out-of-order events, use the deliveredAt timestamp in the meta object. Before you apply an update, compare it with the timestamp from the last processed event for that record. If the incoming event is older, discard it.
For missing fields, validate the payload against a schema and set safe defaults for optional values.
Harden webhook handling for high-volume outreach
Once your debugging process is in good shape, the next move is simple: make sure you almost never need it. When volume climbs, prevention beats cleanup every time.
Validate requests, queue work, and test across environments
Once you know the failure pattern, tighten the handler so the same problem is less likely to come back.
At scale, two controls matter most: signature verification on the raw request body and queue-based processing. Check the Outreach-Webhook-Signature header first, and compare it against the raw bytes. If middleware changes the payload before verification, the HMAC check can fail even when the request is valid.
After verification, send back 200 OK right away and push the payload into a background queue like Redis/Bull, RabbitMQ, or SQS. That split matters. If you handle everything synchronously, the endpoint can fall over when event volume spikes.
Keep staging and production on separate endpoints, each with its own secret. That way, test events stay out of production data. It also helps to run synthetic test events after any schema or workflow change. Add automated schema monitoring too, so field removals get caught before they turn into silent downstream failures.
Use event streams to surface deliverability issues earlier
Once endpoint handling is steady, widen your view to the events that show deliverability trouble first.
Tie integration failures to deliverability events. Platforms like OutreachFox send real-time webhook events for bounces, opens, replies, and mailbox-health changes. That gives your monitoring stack an earlier signal when deliverability problems start affecting sequences.
A good early warning is a >50% decrease in event volume compared to the previous hour. That kind of drop can point to either a provider-side issue or a silent endpoint failure. Pair it with a P99 latency alert at 4 seconds and a signature failure rate alert above 5% over any 5-minute window.
Conclusion: The shortest path to a webhook fix
At high volume, webhook reliability usually comes down to a small set of rules followed over and over. Two design choices do most of the work: idempotent event handling - store event IDs and skip duplicates - and fast acknowledgment with async processing - return 200 OK and do the work in a queue.
Add raw-body verification, separate environments, and event-level monitoring, and most failure modes stop being repeat incidents and start looking like edge cases.
Frequently asked questions
Why does Outreach mark my webhook as failed even though my endpoint returns 200 OK eventually?+
Outreach has a strict 5-second response timeout. If your endpoint takes longer than 5 seconds to return a response—even if it eventually returns 200 OK—the delivery is marked as failed. To fix this, validate the signature and immediately return 200 OK, then queue the actual processing work to run asynchronously in the background.
What is the correct way to log webhook payloads without storing sensitive prospect data?+
Log a SHA-256 hash of the raw request body instead of the full payload. This lets you verify that the bytes your server received match what Outreach sent, which is essential for debugging signature failures, without storing PII or other sensitive data that could create compliance issues.
How do I know if my webhook stopped receiving events silently?+
Monitor your event volume and set an alert for drops greater than 50% compared to the previous hour. Your endpoint can stay online and keep returning 200 OK, but if Outreach stops sending events—due to DNS failures, disabled webhooks, or delivery issues—you won't notice without volume monitoring.
Why do my Outreach webhook signature verifications keep failing after middleware processes the request?+
Webhook signatures are calculated against the exact raw request body bytes. If middleware like body parsers or proxies modify the payload before your verification code runs, the HMAC check will fail even for legitimate requests. Use express.raw() or equivalent to access the raw body before any parsing happens.
What thresholds should I set for alerting on webhook health issues?+
Alert on non-2xx error rates above 10% over 15 minutes, p99 latency above 5 seconds, signature failure rates above 5% over 5 minutes, event volume drops greater than 50% hour-over-hour, and queue depths exceeding 1,000 pending events. These thresholds catch most delivery, timeout, authentication, and processing bottlenecks before they become critical.
How can I replay a failed Outreach webhook request for local debugging?+
Use ngrok to expose your local server with a public HTTPS URL, update the webhook URL in Outreach to point to the ngrok address, then trigger a test event. The ngrok web interface at localhost:4040 shows all requests with full headers and payloads and includes a Replay button to resend the exact same request repeatedly while you debug.
What happens if Outreach cannot resolve the DNS for my webhook endpoint?+
Outreach will temporarily disable the webhook when DNS fails. If DNS resolution issues persist for about a week, the webhook will be permanently disabled. Always ensure your webhook hostname resolves to a public IP address (not a private range) and that your DNS configuration is stable.