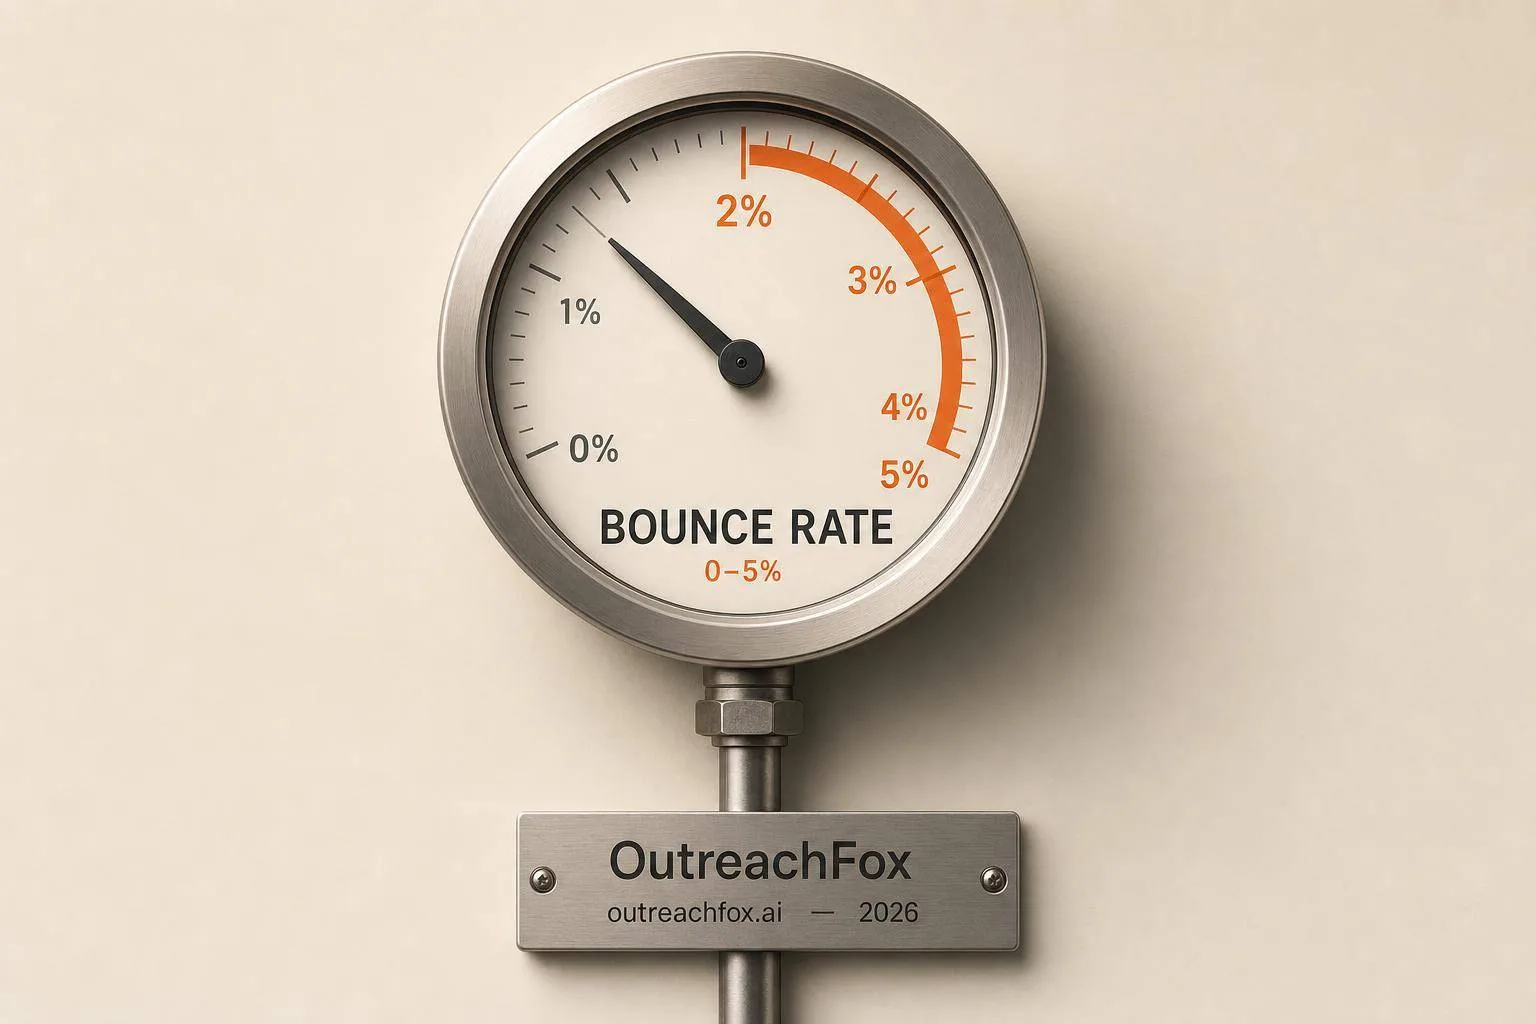
For cold outreach in 2026, keep hard bounce rates under 2%. Top teams stay below 1.5%, while rates above 3% risk sender reputation damage and require immediate list cleanup.
- Hard bounce rates under 1.5% are best-in-class; above 2% triggers reputation risk
- List source is the biggest factor: scraped lists hit 8-22%, verified lists stay at 1-2.5%
- Dedicated mailbox infrastructure outperforms shared setups by reducing bounce variance
- Industries with high turnover like real estate see 1.9-2.3% bounce rates naturally
- Stop sending immediately if bounce rate exceeds 5% to prevent permanent domain damage
- Re-verify any list older than 30 days and limit sends to 30-50 emails per mailbox daily
Bounce Rate Benchmarks for Cold Outreach 2026
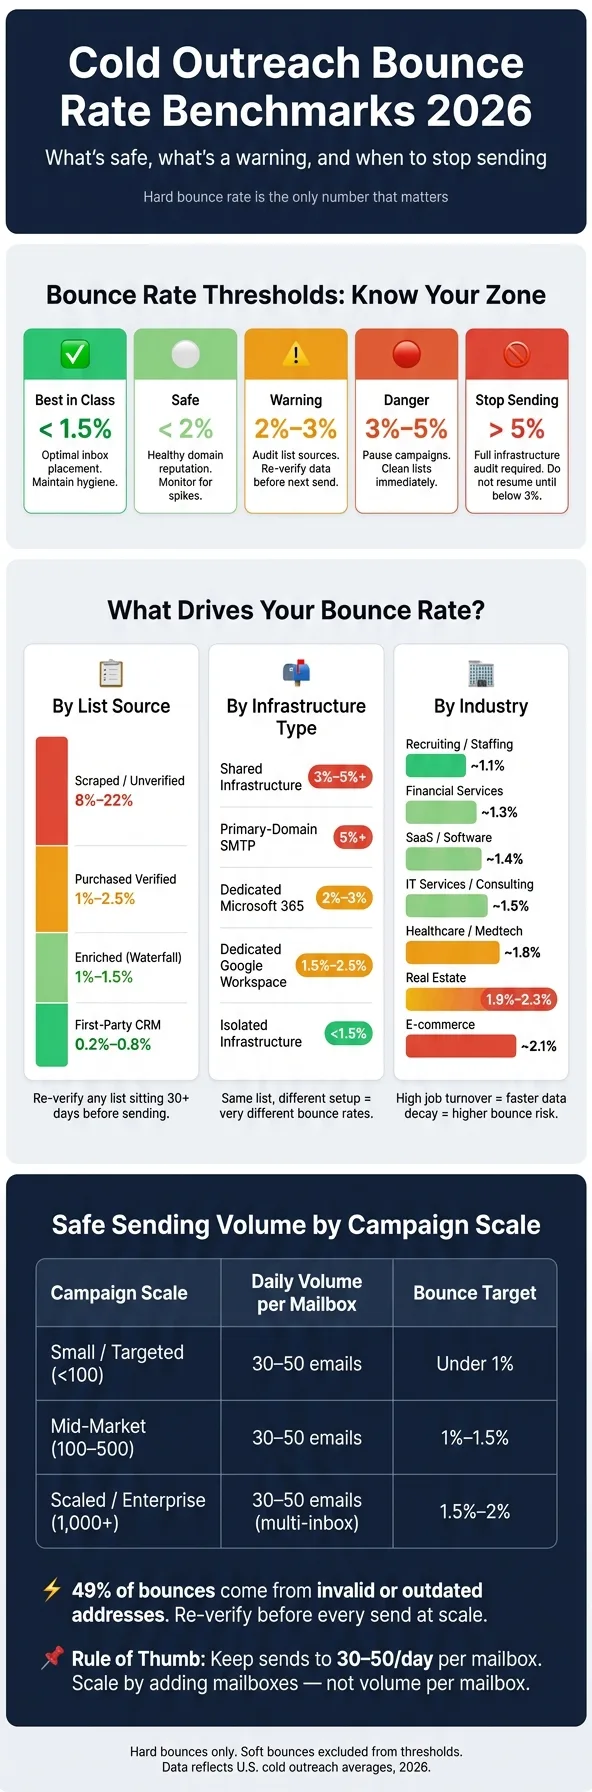
If your hard bounce rate is above 2%, I’d treat it as a problem. For most U.S. cold outreach teams in 2026, under 1.5% is top-tier, 1.5%–2% is safe, 2%–3% is a warning, 3%–5% is danger, and above 5% means stop sending and fix the issue first.
Here’s the short version:
- Average hard bounce rate: about 2.2%
- Scraped or unverified lists: often 8%–22%
- Purchased verified lists: about 1%–2.5%
- Enriched lists: about 1%–1.5%
- First-party CRM lists: about 0.2%–0.8%
- Safe daily volume per mailbox: 30–50 emails
- Main drivers of bounce rate: list source, sending setup, industry, and send volume
A few points matter more than the rest:
- Hard bounces are the number to watch, not total bounces
- A “good” bounce rate depends on where the data came from
- The same list can perform differently based on mailbox setup
- Higher send volume makes weak data show up faster
- Once you cross 3%, sender reputation can slide fast
| Factor | Low End | High End | What I’d watch |
|---|---|---|---|
| List source | 0.2% | 22% | Verification and data age |
| Infrastructure | Under 1.5% | 5%+ | Shared vs. isolated setup |
| Industry | ~1.1% | ~2.3% | Job turnover and role-based emails |
| Volume | Under 1% | 2%+ | Re-verification and mailbox limits |
If I had to boil the article down to one idea, it’s this: bounce rate is not one benchmark. It’s a range shaped by your list, your mailbox setup, your market, and how hard you push volume.
What is considered a good bounce rate in cold email
Bounce Rate Benchmarks by List Source
List source creates the biggest bounce-rate spread in 2026.
Here’s what you can expect from each major source:
| List Source | Expected Bounce Range | Common Failure Mode | Key Takeaway |
|---|---|---|---|
| Scraped / Unverified | 8% – 22% | Stale records, spam traps | High risk of rapid reputation damage |
| Purchased (Verified) | 1% – 2.5% | Verification at purchase only | Acceptable, but needs pre-send re-verification |
| Enriched (Waterfall) | 1% – 1.5% | Catch-all domain issues | Strong coverage when hygiene is maintained |
| First-Party CRM | 0.2% – 0.8% | Data decay from job changes | Cleanest source; requires regular hygiene |
The ranges below show why each source performs so differently.
Purchased and scraped lists tend to produce the highest bounce rates
Scraped and unverified lists sit in the highest-risk group. The reasons are pretty simple: stale records, spam traps, and weak data provenance. That mix can hurt sender reputation fast.
Even purchased verified lists come with real risk. If verification happened only at the time of purchase, some records may already be invalid when you send. So the issue isn’t just where the list came from. It’s how much re-verification it needs before launch.
Enriched and first-party lists land in the middle when hygiene is uneven
For middle-tier sources, the label alone doesn’t tell you much. Verification quality is what drives bounce risk.
Moving from single-provider enrichment to multi-provider enrichment helps a lot. When teams check several sources in sequence and keep the best match, valid contact coverage rises above 90%.
First-party CRM data also gets more trust than it should. It often decays faster than teams expect. In fields with high job turnover, such as Real Estate, CRM bounce rates can climb to 2.3% or more if lists aren’t re-verified before launch.
A solid rule of thumb: re-verify any list that has been sitting for more than 30 days before sending.
Verified lists consistently produce the lowest bounce rates
Pre-send verification keeps bounce rates well below the thresholds that trigger algorithmic penalties from providers like Gmail and Outlook.
Teams that confirm addresses before they enter a sequence stay in the safest range shown in the table.
Bounce Rate Benchmarks by Mailbox Type and Sending Infrastructure
After list source, mailbox infrastructure is the next big reason bounce rates can swing. Two teams can use the same list and still end up with very different results based on where the email is sent from.
Once list quality is under control, infrastructure becomes the next thing that shifts bounce rates.
| Mailbox / Infrastructure Type | Likely Bounce Range | Main Risk Factors | Best-Fit Use Case |
|---|---|---|---|
| Shared Infrastructure | 3% – 5%+ | Shared reputation; one sender's poor hygiene can raise bounce risk for others | Low-volume outreach |
| Dedicated Google Workspace | 1.5% – 2.5% | Stricter spam filtering and authentication checks | High-volume B2B sequences |
| Dedicated Microsoft 365 | 2% – 3% | Toughest filtering; Focused Inbox algorithm | Enterprise to Outlook users |
| Primary-domain SMTP | 5%+ | Permanent domain blacklisting risk; no warmup | Not recommended |
| Isolated Infrastructure | Under 1.5% | Requires managed provisioning | High-scale outbound teams |
Shared infrastructure adds reputation risk that can distort bounce rates
On shared sending platforms, your bounce rate is shaped in part by everyone else using that pool. That's why shared infrastructure often lands in the 3% – 5%+ range.
It isn't always because the list is bad. Sometimes the setup itself is the problem. If another sender has poor list hygiene, your numbers can take a hit too. That's the trade-off with shared systems: less control, more noise.
Dedicated Google, Microsoft, and SMTP mailboxes behave differently at scale
At scale, mailbox type matters a lot. Microsoft 365 often shows higher bounce risk than Google Workspace even when list quality is about the same. Microsoft's filtering is tougher, and the Focused Inbox system adds another layer that can affect outcomes.
Primary-domain SMTP is the riskiest option here. Without warmup or isolation, bounce rates can climb above 5%. Worse, that setup can hurt domain reputation and put the main domain in danger.
Why isolated infrastructure improves monitoring and control
Isolated infrastructure keeps bounce signals separate. That makes it much easier to spot mailbox-level issues, trace the source, and fix problems before they spread.
After infrastructure, industry and send volume explain the rest of the gap.
Bounce Rate Benchmarks by Industry and Send Volume
Industry and send volume explain most of the bounce-rate gap.
Industry affects bounce rates through data freshness and role-based addresses
Some industries naturally land on the low end. Recruiting and Financial Services, for example, sit at about 1.1% and 1.3%. That usually comes down to fresher data and, in finance, tighter rules around data handling.
Other industries run higher. Real Estate often sees more bounces because jobs change fast and contact data goes stale quickly. E-commerce also trends higher, mostly because list-building methods can vary a lot from one team to the next.
| Industry | Bounce Rate Range | Primary Risk Factor |
|---|---|---|
| Recruiting / Staffing | ~1.1% | High engagement; active data |
| Financial Services | ~1.3% | Strict governance; low churn |
| SaaS / Software | ~1.4% | Standard B2B churn |
| IT Services / Consulting | ~1.5% | Moderate role turnover |
| Healthcare / Medtech | ~1.8% | Role-based addresses; strict security |
| Real Estate | 1.9%–2.3% | High job turnover; fast data decay |
| E-commerce | ~2.1% | High variance by list source |
If you're aiming for a bounce rate below 2%, role-based addresses can throw a wrench in the plan. That means filtering addresses like info@, support@, and sales@, with extra care in healthcare.
Send volume makes these gaps more obvious.
Higher send volume exposes weak verification faster
Smaller campaigns, especially those under 50 recipients, tend to have the lowest bounce risk. The reason is simple: they usually get more hands-on review. Once a program moves past 1,000+ recipients, bounce rates often start creeping up if suppression rules, list rotation, and re-verification aren't in place.
A lot of that risk comes from stale data. 49% of bounces come from invalid or outdated addresses.
At scale, send discipline matters just as much as list quality.
One way teams keep big lists cleaner is with waterfall enrichment, where they query multiple providers in sequence. Teams using this method often keep bounce rates in the 1%–1.5% range, versus 3%–5% for single-provider data. OutreachFox does this with field-level waterfalls across 50+ providers and real-time bounce analytics.
| Campaign Scale | Recommended Daily Volume per Mailbox | Expected Bounce Target |
|---|---|---|
| Small / Targeted (<100) | 30–50 emails | Under 1% |
| Mid-Market (100–500) | 30–50 emails | 1%–1.5% |
| Scaled / Enterprise (1,000+) | 30–50 emails (multi-inbox) | 1.5%–2% |
A simple rule of thumb: keep sends per mailbox at 30–50 emails per day. Then grow by adding mailboxes, rotating domains, and re-verifying lists. Those ranges define the safe, warning, and danger bands in the next section.
Safe, Warning, and Danger Levels for Outbound Teams
Even small increases in bounce rate can chip away at sender reputation faster than most teams expect.
Treat the ranges below as action thresholds, not averages.
Safe: under 2%, with under 3% still acceptable for many teams
Top outbound teams usually stay below 1.5%. Anything under 2% is the safe zone. That usually means your domain reputation is in good shape, deliverability risk stays low, and there’s no immediate reason to change course.
The 2% to 3% range can still work, but it should trigger a review before your next send. Check where the list came from, how much of it was verified, and how old the data is.
Here’s the simple operating guide:
| Bounce Rate | Status | What It Means | Action |
|---|---|---|---|
| < 1.5% | Best in class | Optimal inbox placement; high sender trust | Maintain current hygiene |
| < 2% | Safe | Healthy domain reputation | Monitor for spikes |
| 2%–3% | Warning | Reputation starts to slip; algorithmic penalties begin | Audit list sources; re-verify data |
| 3%–5% | Danger | High risk of throttling; more aggressive spam filtering | Pause campaigns; clean lists immediately |
| > 5% | Stop | Domain damage; blocking risk | Stop sending; full infrastructure audit |
Warning and danger: 3% to 5% needs review, above 5% needs immediate correction
Once you hit 3% to 5%, it’s time to pause sending. Re-verify the list and check SPF, DKIM, DMARC, and mailbox health.
If you go above 5%, stop sending right away and fix the source before you resume. Audit both the list and the sending setup, then start again only after the bounce rate drops back below 3%.
Key Takeaways
The short version for outbound teams
Here’s the plain-English version: data quality and control over your sending setup are the two biggest levers.
Scraped lists carry the most risk. Verified and opted-in lists sit at the low end.
After you lock in source quality, use bounce limits to gauge risk. Hard bounce rate should be your main benchmark.
- Under 1.5% = best-in-class
- 1.5% to 2% = safe
- 2% to 3% = warning
- 3% to 5% = danger
- Above 5% = critical
Once you cross 2%, reputation risk starts climbing with providers like Gmail and Outlook.
To keep reputation tied to your own sends, use dedicated outbound domains and isolated setup. Platforms like OutreachFox use private, isolated sending environments and dedicated campaign IPs.
At scale, these same rules hit harder and faster. More volume doesn’t solve bounce issues. It just puts them in the spotlight sooner.
Frequently asked questions
Why does the article recommend stopping all sending if your hard bounce rate exceeds 5%?+
Above 5% bounce rate indicates serious domain damage and blocking risk that requires immediate attention. Continuing to send at this level can cause permanent reputation harm with email providers. The article advises stopping completely, conducting a full infrastructure audit, and only resuming after the bounce rate drops back below 3%.
How do scraped lists compare to first-party CRM lists in terms of bounce rates according to 2026 benchmarks?+
Scraped or unverified lists typically bounce at 8-22%, while first-party CRM lists bounce at just 0.2-0.8%. The massive difference stems from data quality: scraped lists contain stale records and spam traps, while CRM data represents actual business relationships, though it still requires regular re-verification to prevent decay.
What is waterfall enrichment and how does it affect bounce rates at scale?+
Waterfall enrichment queries multiple data providers in sequence and keeps the best match for each contact field. Teams using this method typically maintain bounce rates of 1-1.5%, compared to 3-5% for single-provider data. This approach is particularly valuable for large campaigns exceeding 1,000 recipients where data quality issues become more visible.
Why does Microsoft 365 show higher bounce rates than Google Workspace even with identical list quality?+
Microsoft 365 applies stricter spam filtering and uses the Focused Inbox algorithm, which creates additional filtering layers. This results in typical bounce ranges of 2-3% for Microsoft compared to 1.5-2.5% for Google Workspace, even when the same verified list is used.
What specific daily sending volume does the article recommend per mailbox to maintain low bounce rates?+
The article recommends 30-50 emails per day per mailbox across all campaign scales. Rather than increasing volume per mailbox, teams should scale by adding more mailboxes, rotating domains, and re-verifying lists to maintain bounce rates in the safe zone.
How does industry vertical influence expected bounce rates for cold outreach campaigns?+
Industry bounce rates range from about 1.1% in Recruiting to 2.3% in Real Estate. The variation stems from factors like job turnover rates, use of role-based email addresses, and data freshness standards. Financial Services maintains low rates around 1.3% due to strict governance, while Real Estate struggles with rapid data decay from frequent job changes.
According to the 2026 benchmarks, how often should teams re-verify stored contact lists before sending?+
The article recommends re-verifying any list that has been sitting for more than 30 days before sending. This applies even to first-party CRM data, which decays faster than most teams expect, particularly in industries with high job turnover where CRM bounce rates can climb to 2.3% or higher without regular verification.