
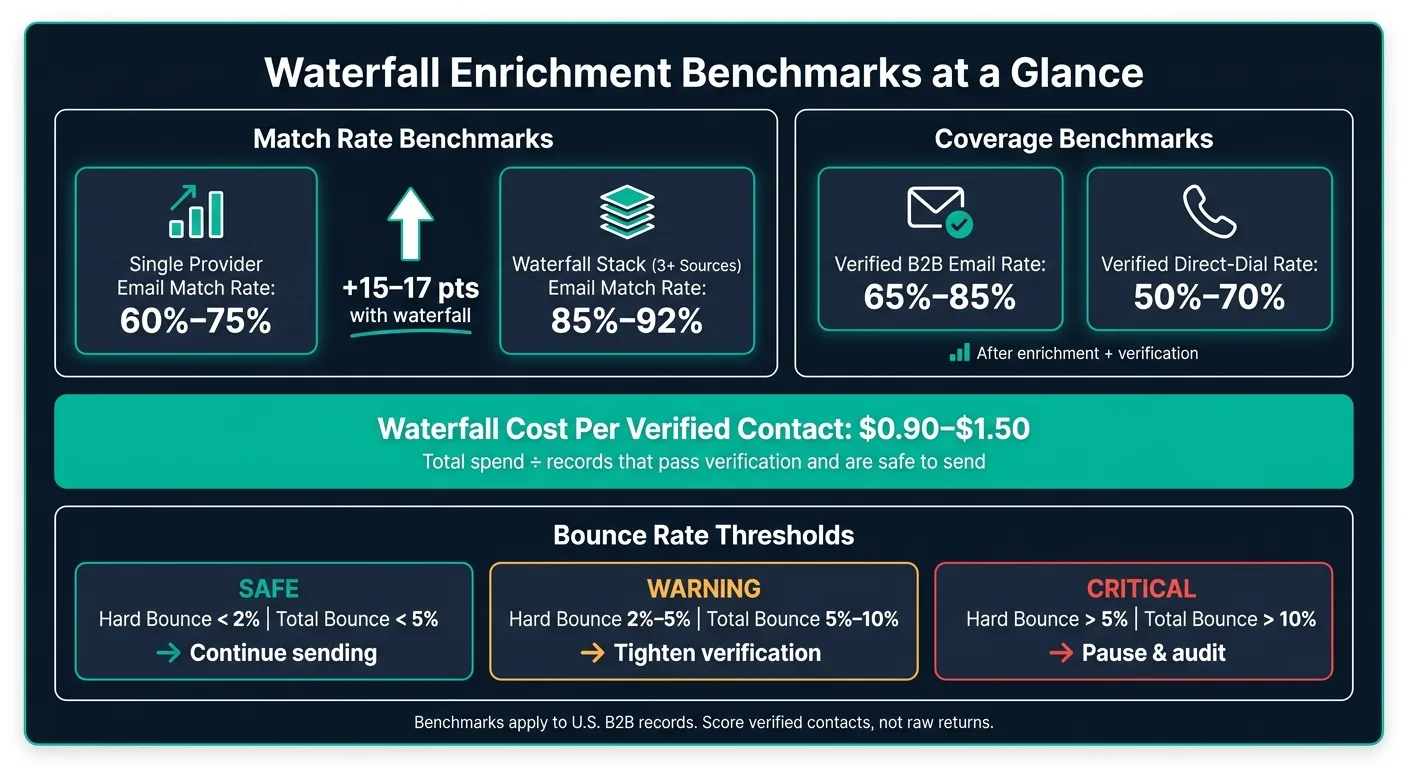
Waterfall enrichment typically achieves 85-92% email match rates with $0.90-$1.50 cost per verified contact. Hard bounce rates under 2% indicate safe data quality.
- Waterfall enrichment delivers 85-92% match rates versus 60-75% from single sources
- Verified email rates after enrichment typically range from 65% to 85%
- Cost per verified contact averages $0.90 to $1.50 in waterfall stacks
- Hard bounce rates under 2% signal safe data; above 5% requires immediate action
- Direct-dial phone rates reach 50-70% in strong U.S. B2B segments
- Evaluate platforms on verified output, not raw match rate alone
Waterfall Enrichment Benchmarks: Match Rate, Cost, Bounce
If I were checking an enrichment tool, I’d judge it on five numbers: match rate, valid email rate, phone-find rate, cost per verified record, and bounce rate. That gives me a clear view of output I can use, not just a big export count.
Here’s the short version:
- Single-source email match rate: 60%–75%
- Waterfall email match rate: 85%–92%
- Verified B2B email rate after verification: 65%–85%
- Verified direct-dial rate: 50%–70%
- Waterfall cost per verified contact: $0.90–$1.50
- Safe hard bounce rate: under 2%
- Warning hard bounce rate: 2%–5%
- Critical hard bounce rate: over 5%
The main point is simple: a high match rate alone is not enough. If records do not verify cleanly or they bounce in live sends, the list costs more than it looks.
A vendor can say it “found” a contact. That does not mean the email is safe to send or the phone number is a direct dial. I’d look at verified output and live bounce results before I’d trust any pitch.
| Metric | Benchmark range | What I’d look for |
|---|---|---|
| Email match rate | 60%–75% single source; 85%–92% waterfall | More returned contacts from multi-source lookup |
| Valid email rate | 65%–85% | Emails that pass verification |
| Direct-dial rate | 50%–70% | Person-level numbers, not company lines |
| Cost per verified contact | $0.90–$1.50 | Total spend divided by usable contacts |
| Hard bounce rate | < 2% safe; 2%–5% warning; > 5% critical | Whether the data holds up in sending |
My takeaway: I would buy based on verified contacts at a safe bounce rate, not raw database size, not demo output, and not list price per lookup.
Match rate, valid email rate, and phone-find rate benchmarks
Work email match rate: single-source vs. waterfall
Work email match rate usually falls between 60% and 75% with a single provider. When you use waterfall enrichment and check several providers one after another, that rate often climbs to 85% to 92%.
| Enrichment approach | Typical email match rate |
|---|---|
| Single provider | 60%–75% |
| Waterfall stack (3+ sources) | 85%–92% |
That jump looks great on paper. But there’s a catch: higher match rates only matter if the email addresses you get back can still verify at a usable rate.
Valid email rate benchmarks after verification
Match rate by itself doesn’t tell the whole story. If the addresses don’t verify cleanly, they’re not much use.
After enrichment and verification, verified B2B email rates usually end up in the 65% to 85% range. That gap matters more than it may seem at first glance. It’s the difference between data that was returned and data you can actually send to.
Email coverage is only part of the picture. Phone coverage needs the same level of scrutiny.
Phone-find rate and direct dial benchmarks
In strong U.S. B2B segments, verified direct-dial availability usually lands between 50% and 70%. That’s the number to pay attention to.
A lot of providers will say they found a phone number for a large share of records. Sounds good. But many of those numbers are company main lines, not direct dials. And if your team needs to reach a person fast, that difference is a big deal.
When you review any enrichment platform for phone coverage, ask for the verified direct-dial rate, not just the total phone-find rate.
Once coverage is clear, the next question is cost per verified contact.
Cost benchmarks: what a verified record actually costs
Cost per query vs. cost per verified contact
Once your coverage is above the benchmark, the next thing to check is cost per verified contact.
This is where a lot of teams get tripped up. A vendor’s list price almost never reflects what you’ll pay in practice. The number that matters is simple: total spend divided by the records that pass verification and are safe to send.
That’s the metric to watch. Cheap queries don’t mean much if verification strips out a big chunk of the output.
Typical cost ranges for waterfall enrichment stacks
A well-built waterfall stack usually lands between $0.90 and $1.50 per verified contact.
That range includes credits used across several provider lookups, plus the added cost of verification. So even if one source looks cheap on paper, the full stack cost needs to account for every lookup that happens before you get a usable record.
Comparison table: single provider, waterfall stack, enterprise database
| Provider type | List price per query | Typical match rate | Valid email rate | Cost per verified contact |
|---|---|---|---|---|
| Single provider | Moderate | 60%–75% | 60%–80% | High from failed queries |
| Waterfall stack (3+ sources) | Varies by source | 85%–92% | 90%+ (verified) | $0.90–$1.50 |
| Enterprise database | High annual minimum | High | Moderate | High after overhead |
Waterfall enrichment wins on usable output, not sticker price.
Next, bounce thresholds show whether that lower cost still holds up in live sending.
Bounce benchmarks: safe, warning, and critical thresholds
Hard bounce and total bounce thresholds that matter
Low cost doesn't mean much if your list can't reach inboxes. Bounce rate is the last gut check on whether enrichment is safe to send. It's the live sending test for the match-rate and valid-email benchmarks covered earlier.
There isn't just one line in the sand. What matters is whether bounce activity stays low after verification or starts bunching up the moment campaigns go live. When data is old or not updated often, hard bounces tend to show up fast.
What poor enrichment looks like in live campaigns
Poor enrichment usually shows up in a few obvious ways: concentrated hard bounces, catch-all failures, and mailbox-level spikes. When that happens, the source often lacks current job-change data or up-to-date mailbox status.
Use the thresholds below to decide whether to keep sending, tighten verification, or hit pause.
Bounce threshold response table for operators
| Status | Rate band | Signal | Recommended action |
|---|---|---|---|
| Safe | Hard bounce < 2%, total bounce < 5% | Bounce activity stays low and scattered after verification | Continue sending and monitor trends |
| Warning | Hard bounce 2%–5%, total bounce 5%–10% | Catch-all failures or isolated hard bounces start to appear | Tighten verification, review the source, and segment the list |
| Critical | Hard bounce > 5%, total bounce > 10% | Domain-specific hard-bounce clusters or mailbox-level spikes emerge | Pause sends, clean the list, and audit the waterfall stack before resuming |
If bounce patterns get worse, re-verify the list, isolate the source, and pause sends to affected domains.
How to evaluate platforms against these benchmarks
What to test in a pilot or vendor evaluation
Once you’ve set your benchmark ranges, run a controlled pilot to see which vendor actually stays within them.
Use the same metrics throughout the test:
- match rate
- verified email rate
- phone-find rate
- cost per verified record
- hard bounce rate
Keep the pilot limited to U.S. records only. International data can throw off match and bounce rates, which makes side-by-side comparison messy.
Also, score verified records, not raw returns. That’s the part that matters. The main question isn’t how many contacts a platform spits out. It’s how many make it through enrichment, verification, and delivery without adding avoidable bounce risk.
Platform example: evaluating OutreachFox on enrichment and deliverability controls
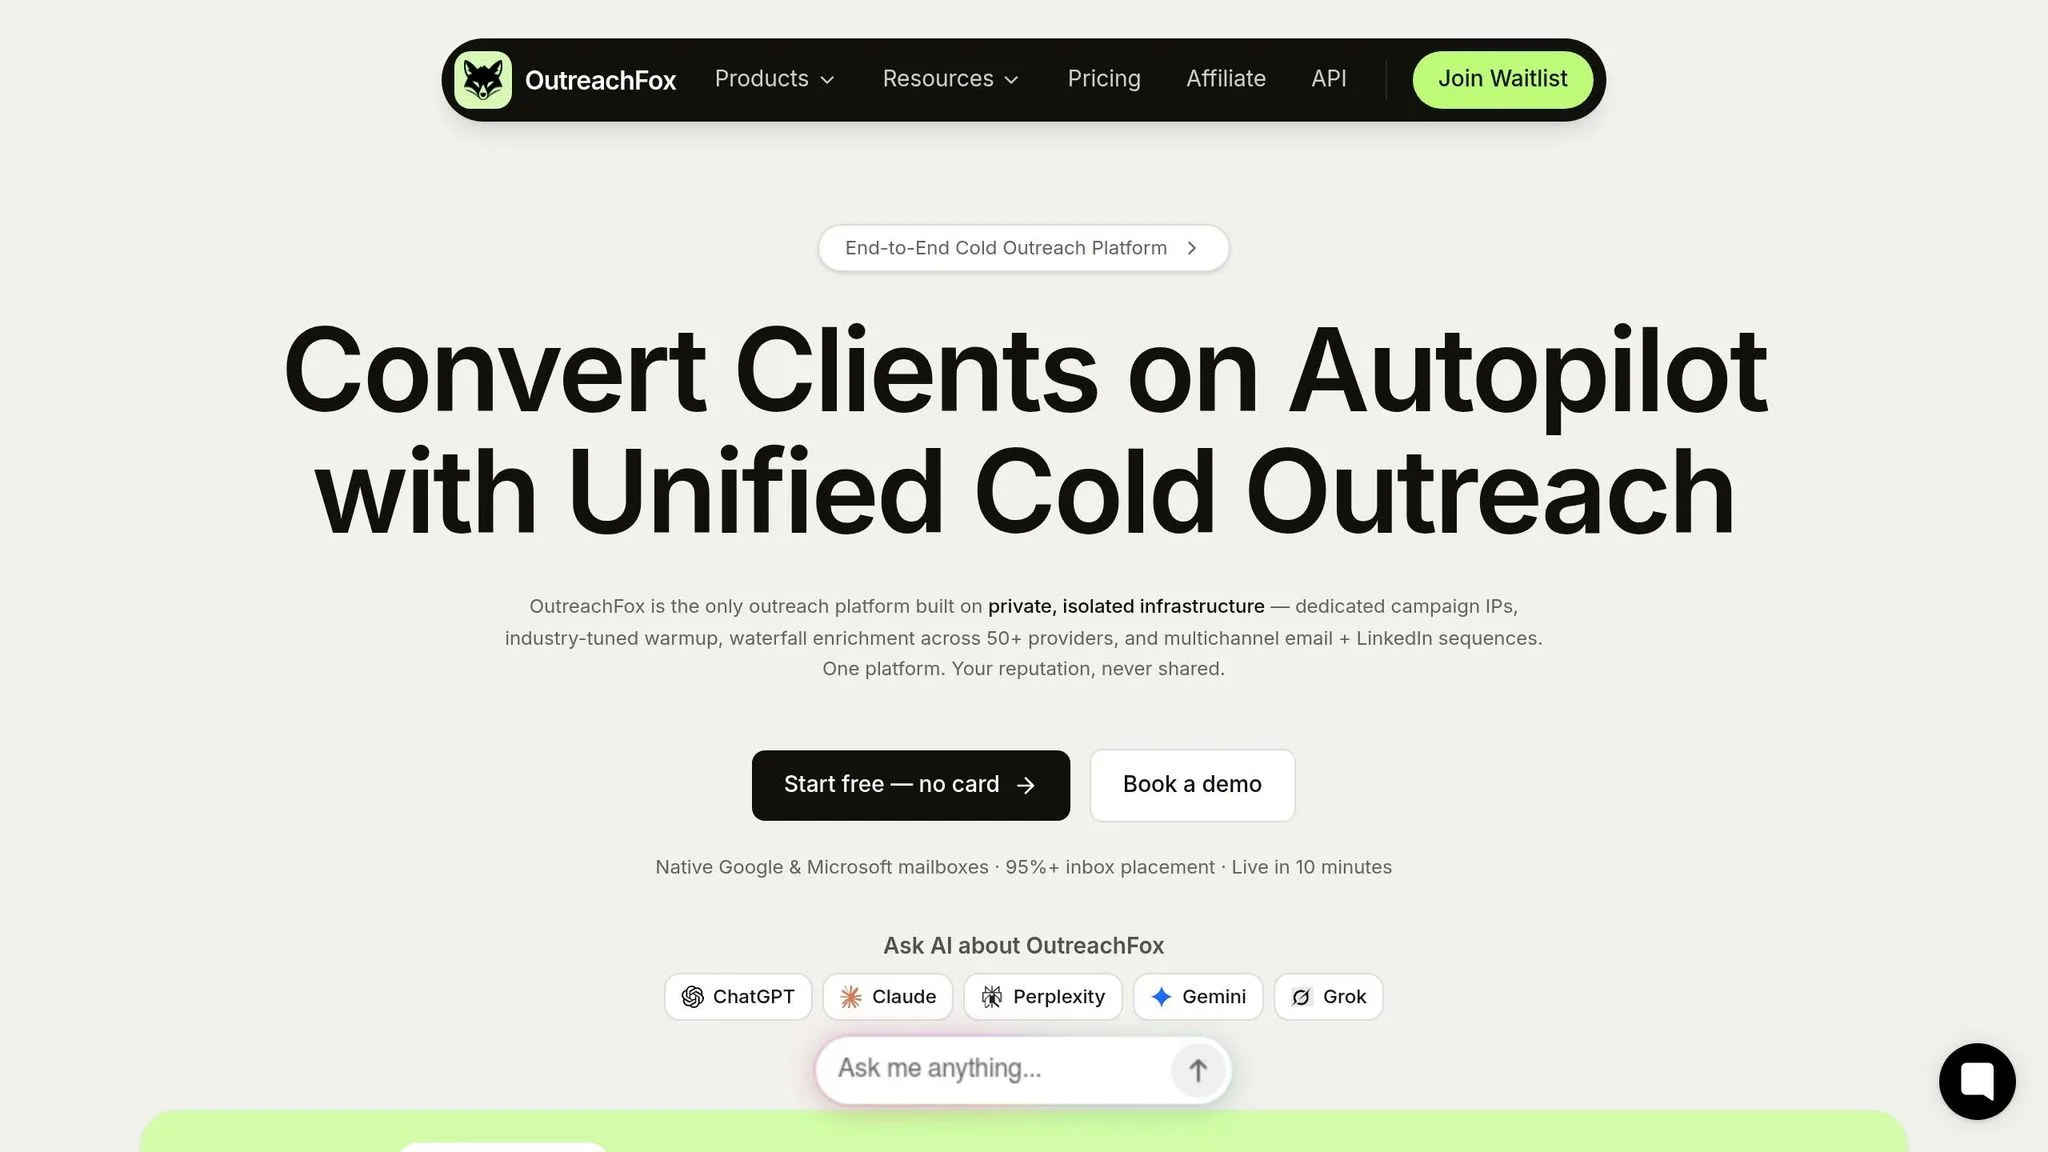
One platform that can be tested against this framework is OutreachFox. It combines waterfall enrichment across 50+ providers, built-in email verification, isolated sending infrastructure, and real-time analytics.
Bounce and mailbox-health events are available in real time, so teams can catch problems early and adjust suppression handling during live campaigns. In plain English: you can track the whole chain in one place instead of stitching it together across multiple tools.
Conclusion: the benchmark ranges that should drive the buying decision
Choose the platform that improves verified output across the full chain: match rate, verified email rate, phone-find rate, cost per verified record, and bounce rate.
If a platform can’t report on all five of those metrics - and only shows match rate on its own - you don’t have enough information to make a sound buying decision.
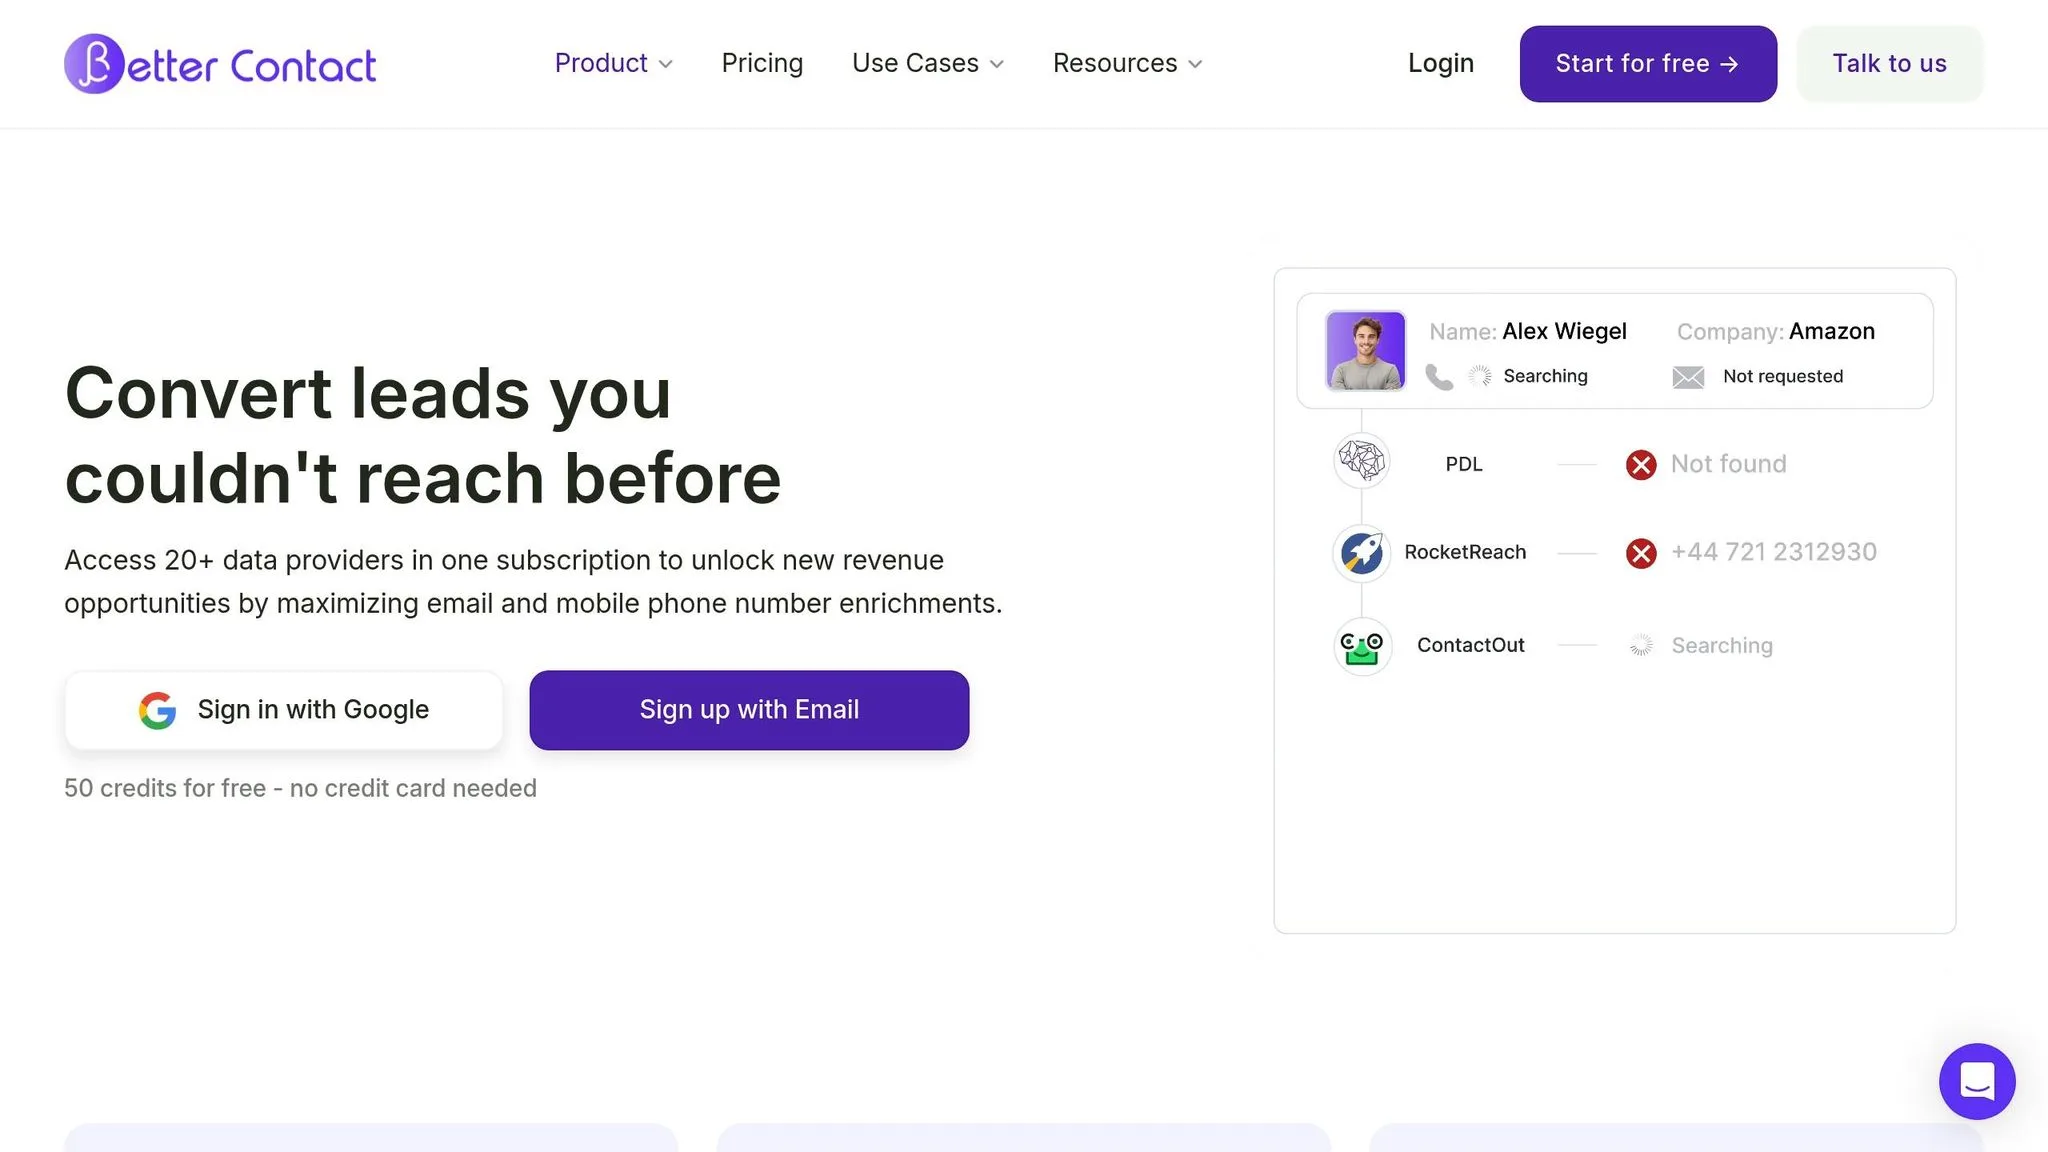
Waterfall Enrichment: Find Every Email With BetterContact
Frequently asked questions
What is the difference between single-source and waterfall enrichment match rates?+
Single-source enrichment typically achieves 60-75% email match rates, while waterfall enrichment that checks multiple providers sequentially reaches 85-92%. The waterfall approach queries several data sources one after another to find contacts that a single provider might miss, significantly improving coverage.
Why does this article emphasize verified contacts instead of raw match rates?+
A high match rate alone doesn't guarantee usable data—emails must pass verification and avoid bouncing during actual sends. The article shows that verified B2B email rates typically fall to 65-85% after verification, meaning match rate can be misleading. Cost per verified contact and bounce rates are better indicators of actual data quality than raw database returns.
What bounce rate thresholds indicate safe versus problematic enrichment data?+
Hard bounce rates under 2% are safe, 2-5% represent a warning zone requiring tighter verification, and over 5% is critical requiring immediate action. These thresholds help operators identify when enrichment sources are outdated or unreliable before sender reputation suffers.
How much should waterfall enrichment cost per verified contact?+
A well-built waterfall stack typically costs $0.90-$1.50 per verified contact. This includes credits used across multiple provider lookups plus verification costs, which gives a more accurate picture than list price per query alone since many queries don't result in usable records.
What is the difference between phone-find rate and direct-dial rate in enrichment?+
Phone-find rate counts any phone number returned, including company main lines, while direct-dial rate measures person-level numbers only. The article recommends targeting 50-70% verified direct-dial rates for U.S. B2B segments, as company switchboards aren't useful for direct outreach.
What five metrics does the article recommend for evaluating enrichment vendors?+
The five key metrics are match rate, verified email rate, phone-find rate, cost per verified record, and hard bounce rate. Evaluating all five together provides a complete picture of usable output, while relying on match rate alone can be misleading since it doesn't account for verification failures or delivery issues.